 Emily John·5hr ago
Bitcoin price is currently gaining momentum above $27,500 against the US Dollar. BTC could rally further above $28,350 as long as it is above $27,000.
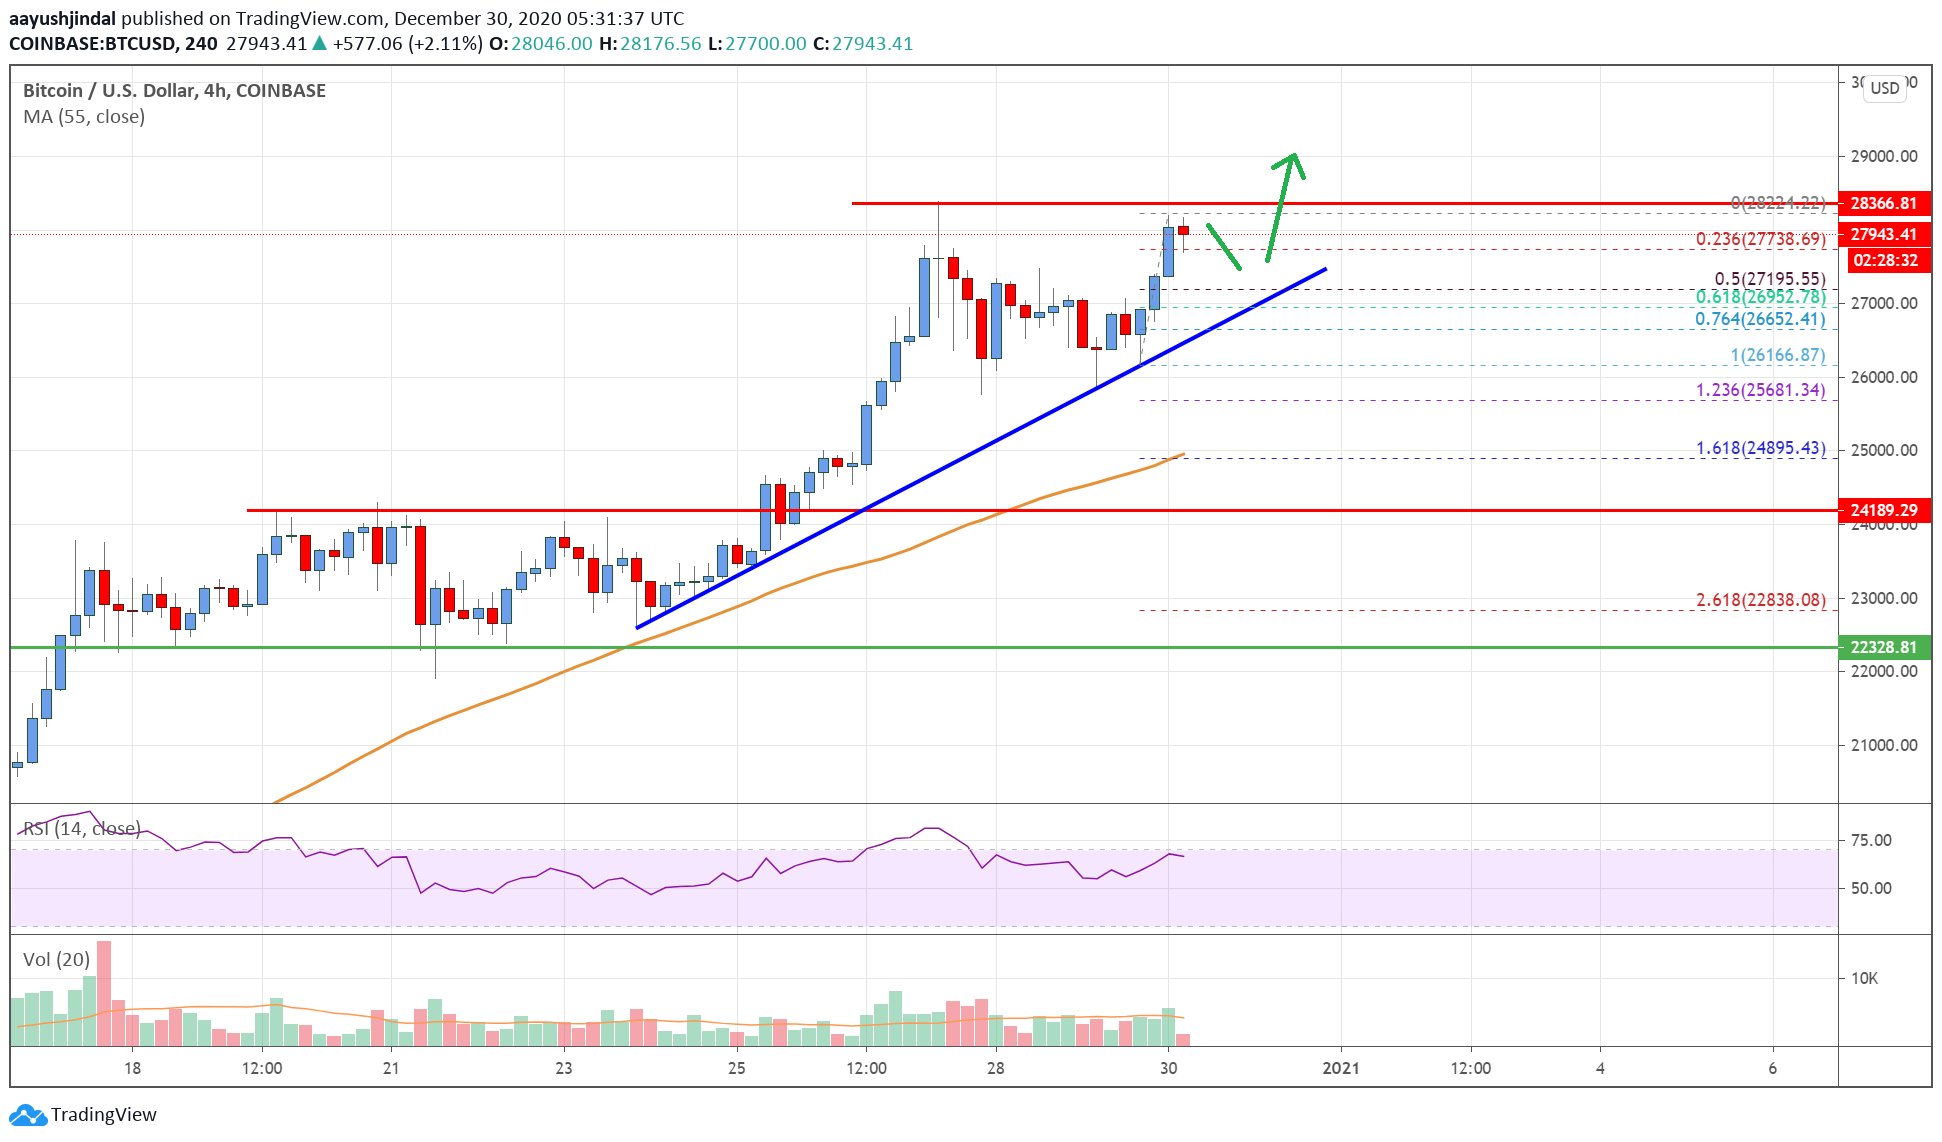
Recently, bitcoin price saw a minor downside correction from the $28,350 high against the US Dollar. BTC traded below the $27,500 and $27,000 levels. However, it remained well bid above the $26,000 level and the 55 simple moving average (4-hours).
A new support base was formed near the $26,000 and $25,850 levels. The recent swing low was near $26,166 before the price climbed higher. It broke the $27,000 and $27,500 resistance levels.
The price even cleared the $28,000 resistance, but it struggled again to clear the $28,350 resistance zone. A high is formed near $28,224 and the price is currently correcting lower. It already tested the $27,800 level, and the 23.6% Fib retracement level of the recent upward move from the $26,166 swing low to $28,224 high.
On the downside, there is a strong support forming near the $27,150 level. There is also a major bullish trend line forming with support near $27,150 on the 4-hours chart of the BTC/USD pair.
The trend line is close to the 50% Fib retracement level of the recent upward move from the $26,166 swing low to $28,224 high. Any more losses could lead the price back towards the $26,000 support zone.
On the upside, the $28,000 and $28,350 levels are important hurdles. A successful close above the $28,000 level, with a follow up move above the $28,350 level could open the doors for a surge towards the $30,000 level.
Looking at the chart, bitcoin price is clearly trading nicely above $27,000 and the 55 simple moving average (4-hours). Overall, the price is likely to continue higher if it clears the $28,000 and $28,350 resistance levels.
4 hours MACD – The MACD is showing positive signs in the bullish zone.
4 hours RSI (Relative Strength Index) – The RSI is still well above the 55 level.
Key Support Levels – $27,000 and $26,000.
Key Resistance Levels – $28,000, $28,350 and $29,200.
Related News
Explore more