

Latest in Ethereum Price
145
Total stories
13
Writers
ETH’s Sunday Bounce Looks Corrective – $2420 Is the Line That Changes Everything
April 22, 2026
ETH Hits 0.80 MVRV Band: Bull Rally Coming?
April 1, 2026
Ethereum Price Slips Below $2.1K as Coinbase Flags L1 Revival
March 28, 2026
Ethereum OG Dumps 7,302 ETH After 4 Years: $5.3M Profit Revealed
March 27, 2026
Ethereum Price Analysis: Key Drivers, Predictions, and How to Read ETH Forecasts
Ethereum price analysis offers a window into the utility supporting the Ethereum network. See also: Ethereum price prediction can eth hit new highs before year. It connects price movements with usage, investment demand, liquidity, and changing market expectations. This wider view helps readers understand why ETH rarely moves for only one reason.
Bitcoin trends, economic conditions, regulation, and network activity can influence the ethereum price together. Also covered: Ethereum price prediction eth targets 6800 as top crypto altcoin. News headlines and leveraged trading can also speed up short-term market moves. Therefore, readers need more than one chart or viral target before reaching conclusions.
This guide explains Ethereum fundamentals, technical tools, on-chain data, and common forecast methods. It also shows readers how to question an Ethereum price prediction without dismissing useful evidence. Also covered: Ethereum price prediction 2026 eth eyes key reversal zone while. The goal is clear analysis, not moon promises, dump talk, or financial advice.
What Is Ethereum Price Analysis?
Ethereum price analysis studies the forces affecting ETH demand, supply, liquidity, and investor behavior. Related: Ethereum sell off blackrock leads 224m crypto etf outflows as.
Analysts combine market charts, network data, fund flows, and wider economic conditions. They aim to explain market moves and identify possible future paths.
Good analysis does not present one outcome as certain. Instead, it outlines bullish, neutral, and bearish conditions using available evidence. It should also explain which developments would weaken its central argument.
This framework helps readers understand forecasts without copying another trader’s position. It can guide research, but it cannot remove risk or market uncertainty. Readers should always consider their own goals, timing, and risk limits.
Why Ethereum’s Price Matters
Ethereum remains the second-largest cryptocurrency by market value, according to CoinGecko. Further reading: Ethereum price forecast ecoyield expected to outperform market with potential. Its size makes ETH an important measure of demand across the wider crypto market. Large ETH moves can also influence confidence across many altcoins.
Ethereum supports decentralized finance, NFTs, stablecoins, tokenized assets, and Layer 2 networks. The official Ethereum website describes a global network for assets, data, and applications. ETH also pays transaction fees and supports staking across the network.
Investors watch the ETH price because it connects technology with a widely traded asset. Also covered: Bitmine grows eth treasury as price dips.Traders also compare ETH against Bitcoin during flippening price debates. See also: Eth price prediction will eth hit 3800 or crash below. However, short periods of stronger performance do not confirm permanent market leadership.
What This Article Covers
This article explains the main market and network drivers affecting Ethereum’s price. Related: Ethereum price ethereum 5k surge 3 signs of bullish reversal. These include sentiment, Bitcoin correlation, usage, upgrades, regulation, and token supply. It also covers ETF flows, whale activity, treasuries, and leveraged liquidations.
The guide then explains how analysts build an ETH forecast across different periods. It reviews fundamental analysis, technical analysis, on-chain models, and media narratives. Each method offers useful information, but each also has clear limits.
The final sections show readers how to compare forecasts and build possible scenarios. They also list practical tools for tracking ETH and related market data. Further reading: Outdated vaneck eth price call new data pushes 2030 target. The FAQ answers common questions about flows, whales, liquidations, and Tom Lee or BitMine. Related: Ethereum news tom lees bitmine buys 54156 eth total holdings.
Key Drivers of Ethereum’s Price
ETH price is driven less by one chart pattern and more by recurring mechanisms. Spot ETF inflows and outflows measure demand through regulated investment products. Still, prices can fall while inflows appear because other sellers may outweigh that demand.
Multiweek ETF outflows can pressure the market, but they do not guarantee further losses. Whale accumulation or long-term holder sales can change confidence and near-term supply. Founder-linked sale headlines may also trigger fear before the market confirms actual selling.
Crowded leverage can unwind through liquidations and increase short-term volatility. Corporate ETH treasuries and application TVL provide useful demand context, not fixed price targets. Staking ETF headlines add another investment channel, but detailed product coverage belongs elsewhere.
Market Sentiment and Bitcoin Correlation
ETH often moves with Bitcoin because both assets respond to wider crypto sentiment. Strong Bitcoin demand can attract capital across major digital assets. A sharp Bitcoin decline can pressure ETH despite positive Ethereum news.
The relationship is not constant, and ETH can outperform during stronger ecosystem activity. ETH may also rise against the dollar while weakening against Bitcoin. Therefore, readers should examine both dollar performance and the ETH-to-Bitcoin ratio.
Risk appetite outside crypto also shapes sentiment and liquidity. Falling equities, rising yields, or geopolitical stress can reduce demand for volatile assets. Investors holding large bags should avoid letting personal exposure replace evidence.
Network Usage and On-Chain Activity
Network activity provides important context for the Ethereum price and its long-term demand. Analysts track transactions, active addresses, gas fees, smart contracts, and stablecoin transfers. Etherscan provides charts covering many of these network measures.
Higher activity can support fee income, token burns, and Ethereum’s utility narrative. However, rising usage does not guarantee an immediate ETH price increase. ETH can still decline during a broad market selloff or liquidity shock.
DeFi activity adds another useful measure of capital use across Ethereum applications. DefiLlama tracks Ethereum TVL, fees, revenue, and trading activity. TVL provides context, but deposited assets do not create a direct ETH price target.
Upgrades and Roadmap Developments
Ethereum upgrades can improve scaling, security, efficiency, and the user experience. The official Ethereum roadmap outlines planned and completed protocol improvements. These changes can shape long-term expectations for network growth.
Ethereum uses a rollup-focused plan to increase transaction capacity. Rollups process activity outside the main chain and return results to Ethereum. This approach can lower user costs while keeping a connection with Ethereum’s security.
Still, upgrades do not guarantee an immediate rise in the ETH price. Markets may price expected benefits before a change reaches the network. Delays, weak adoption, or technical problems can also reduce the expected impact.
Regulatory and Macro Factors
Regulation can change market access, compliance costs, and institutional demand for ETH. The SEC approved exchange proposals for spot Ether products in May 2024. Readers can review the official SEC approval order.
Spot ETFs created another regulated route for investors seeking Ethereum exposure. However, ETF inflows do not guarantee higher prices during every trading session. Direct holdings, derivatives, staking, and offshore markets also influence demand.
Macroeconomic conditions can strengthen or weaken these crypto-specific drivers. Higher rates and tighter liquidity often reduce demand for risky assets. Inflation, employment, credit stress, and geopolitical events can change that relationship.
Supply Dynamics and Tokenomics
ETH supply changes through issuance, fee burning, staking, and holder activity. The Ethereum supply guide explains how issuance and burning shape total supply. Their balance can produce either supply growth or contraction.
EIP-1559 introduced a base transaction fee that the network burns. Higher mainnet activity can increase burns, while lower fees can reduce them. The ultrasound money narrative therefore depends on actual network conditions.
Staking can reduce immediately tradable supply, although staked ETH remains within total supply. Ethereum’s proof-of-stake guide explains how validators lock ETH to support network security. Withdrawals do not always signal selling because holders may change services or custody.
How Ethereum Price Predictions Are Made
Analysts build forecasts using different methods, assumptions, and time horizons. Some focus on adoption, while others prioritize charts, flows, or market cycles. No single method can explain every short-term move or long-term outcome.
Viral ETH forecasts often skip market drivers, valuation effects, and invalidation levels. Moon targets and guaranteed year-end calls deserve caution without clear supporting evidence. Strong forecasts explain both their assumptions and their uncertainty.
ETF flows and application TVL can support a broader Ethereum thesis. However, neither metric replaces liquidity analysis, market-cap math, or clear risk framing. Readers should ask what conditions must develop before accepting any target.
Fundamental Analysis for ETH
Fundamental analysis studies Ethereum as a network, platform, and economic system. Analysts review users, fees, developers, applications, staking, and institutional access. They also examine whether these areas create lasting demand for ETH.
Some analysts describe ETH as digital oil because applications require transaction fees. Others compare Ethereum with a technology platform supporting many digital services. These descriptions help explain value, but they do not create a price target.
A stronger approach connects adoption with specific sources of ETH demand. These sources may include fees, collateral, staking, settlement, ETFs, and corporate treasuries. Analysts should also consider competition from other smart-contract networks.
Technical Analysis Basics
Technical analysis studies price trends, volume, momentum, and market structure. Traders use these tools to form short-term and medium-term views. Support marks buying areas, while resistance marks earlier selling areas.
According to TradingView, moving averages help compare the current ETH price with wider market trends. RSI measures momentum, while MACD can show changes in trend strength. Volume helps confirm whether a breakout attracts meaningful participation.
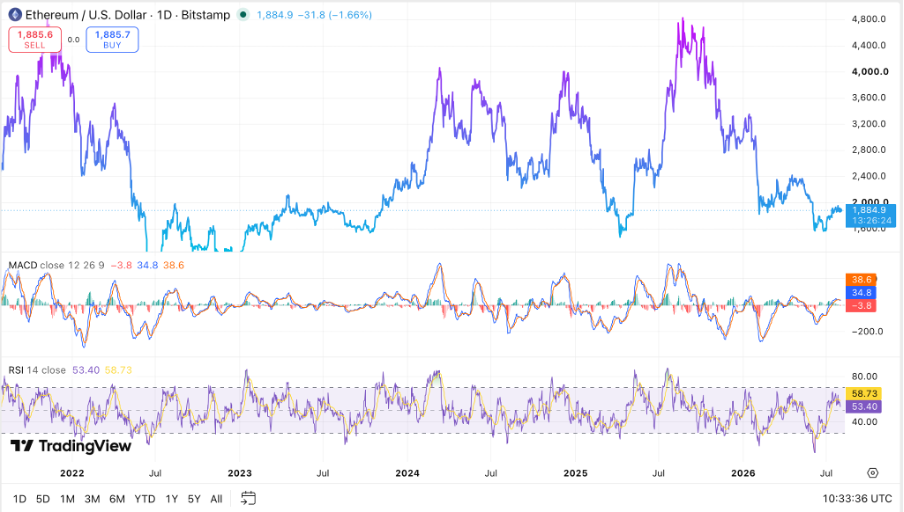
No indicator should determine a forecast alone. Stronger analysis combines trend, levels, volume, timing, and a clear invalidation point. Readers should also match the chart timeframe with their intended holding period.
On-Chain and Data-Driven Models
On-chain analysis reviews activity recorded directly across Ethereum. Common measures include exchange flows, addresses, staking deposits, fees, and whale balances. These figures can show changes that price charts may not reveal immediately.
Exchange inflows may suggest possible selling, while outflows may suggest longer holding. However, transfers can also reflect custody changes or internal exchange movements. Wallet labels can be incomplete, so large transactions require careful review.
Dune supports custom blockchain dashboards, while Etherscan provides direct transaction records. Data-driven models may combine these sources with price, derivatives, and economic data. Their value depends on clean inputs, clear methods, and realistic assumptions.
The Role of Narratives and Media
Narratives shape attention, expectations, and trading behavior across crypto markets. Ethereum examples include ultrasound money, staking yield, tokenization, and flippening price debates. These stories can support demand before network data confirms lasting change.
Headlines about founder sales can create panic because confidence moves faster than fundamentals. A transfer to an exchange may raise concerns without proving an actual sale. Readers should check transaction size, destination, history, and confirmed disclosures.
Tom Lee and BitMine often appear in Ethereum news because of bullish views and treasury activity. Related: Arthur hayes bullish on eth predicts 20k surge. BitMine’s investor relations page publishes company updates and chairman messages. These inputs may affect sentiment, but they are not a complete price model.
How to Read Ethereum Price Forecasts Critically
Readers should examine the reasoning behind a forecast before considering its target. A useful ETH forecast explains time, assumptions, evidence, risks, and invalidation. The loudest prediction is not always the most useful one.
Good forecasts separate confirmed data from personal opinion and promotional language. They also explain what would change the analyst’s view. Without those details, readers cannot test the forecast against later developments.
Critical reading does not require rejecting every bold target. Instead, it requires checking whether the target follows from clear evidence. Readers should also compare the forecast with wider market conditions.
Check the Time Horizon
Short-term forecasts usually cover several days or weeks. They rely more heavily on charts, liquidity, news, and derivatives positioning. Sudden events can quickly weaken these forecasts.
Mid-term forecasts often cover several months and include wider market cycles. ETF flows, economic policy, upgrades, and adoption trends may receive greater attention. These forecasts still face large changes in market sentiment.
Long-term forecasts may cover several years and depend on broader assumptions. Adoption, regulation, competition, and token supply become more important over time. A daily RSI reading cannot support a reliable five-year target.
Look for Clear Assumptions
Every Ethereum price prediction depends on assumptions, whether stated or hidden. Readers should identify expected growth, liquidity, regulation, and market share. They should also check whether those assumptions can be measured.
A bullish forecast may require stronger ETF demand and growing network activity. It may also assume lower interest rates or weaker competition. Each requirement should appear clearly within the analysis.
Market-cap effects also matter when forecasts use very high price targets. The analyst should explain where the required demand could originate. Without that explanation, a precise target can create false confidence.
Beware of Extreme Targets Without Reasoning
Very high or very low targets often attract the most attention. However, attention does not improve accuracy or reduce risk. Extreme targets need stronger evidence than moderate forecast ranges.
Red flags include guaranteed language, missing methods, selective data, and no downside case. Forecasts should also explain the level or event that invalidates their view. Without invalidation, any result can be presented as temporary.
Emotional bias can influence both readers and analysts. Investors holding large bags may prefer bullish claims, while bearish traders may expect another dump. Clear evidence should remain more important than either position.
Use Multiple Sources
Readers should compare forecasts from analysts, data platforms, and official sources. Different sources may use different periods, methods, and assumptions. These differences can reveal risks hidden within one forecast.
The goal is not to average every available price target. Readers should compare reasoning, evidence, ranges, and invalidation conditions. Agreement between sources improves context, but it does not remove uncertainty.
Official documents can confirm upgrades, regulations, and company activity. Market platforms can provide prices, flows, and derivatives data. Independent reports can then explain how those developments may affect demand.
Common Ethereum Price Scenarios
Scenario analysis replaces false certainty with several possible market paths. Each scenario should identify the conditions supporting a different ETH outcome. It should also explain what would weaken that view.
Bullish, base, and bearish cases are not predictions with equal odds. They are frameworks for tracking changing evidence over time. Readers can update them as market and network conditions develop.
This method is more useful than following one fixed number. It encourages readers to watch drivers instead of defending earlier forecasts. It also makes risk discussions clearer and more practical.
Bullish Scenario
A bullish scenario could include stronger network activity and rising institutional demand. Supportive regulation and better economic liquidity could add further strength. Layer 2 growth may also expand Ethereum’s reach across new applications.
ETF inflows and corporate treasury purchases could support demand during this scenario. Growing staking participation may reduce immediately tradable supply. Higher mainnet activity could also increase ETH burns.
Technical confirmation would require sustained breakouts with stronger volume. Former resistance zones should hold as support during later pullbacks. The bullish case weakens when activity falls, flows reverse, or breakouts fail.
Base Case Scenario
A base case assumes moderate adoption and continued network development. Economic conditions may remain mixed, limiting sustained risk demand. ETH could trade within broad ranges during this period.
Network use may improve slowly without producing immediate price growth. ETF inflows could alternate with outflows across several weeks. Corporate treasury demand may also slow when financing conditions tighten.
Traders would watch range boundaries, moving averages, and volume changes. Long-term holders may focus more on staking and ecosystem progress. This case avoids both moon expectations and severe dump forecasts.
Bearish Scenario
A bearish scenario could involve weaker adoption and tighter economic conditions. Regulatory pressure or falling investment flows could reduce market confidence. Stronger competition may also draw users and capital elsewhere.
Lower application activity may reduce demand for Ethereum blockspace. Weaker fees could also reduce burns and challenge the ultrasound money narrative. Heavy liquidations may then deepen losses during support breaks.
A bearish trend would show lower lows and weak recovery volume. The case would weaken if ETH reclaimed support and network data improved. Bearish social media posts alone cannot confirm this scenario.
Tools and Resources for Tracking Ethereum Price
Readers can improve their research by combining charts, network data, and verified news. No single website provides every detail needed for strong analysis. Using several sources can reduce dependence on one method.
Price platforms show market performance, while blockchain tools show network activity. ETF and derivatives platforms provide information about institutional and leveraged positioning. Official sources confirm upgrades, regulations, and company disclosures.
Readers should also record the date and timeframe for every figure. Live values can change before an article reaches publication. Historical context helps prevent overreaction to one daily move.
Price and Chart Platforms
CoinGecko provides the Ethereum price, market value, supply, volume, and historical performance. It also allows readers to compare ETH with other digital assets. Market figures can change quickly, so publication times matter.
Chart platforms and major exchanges provide candlestick charts and technical tools. Readers can examine daily and weekly trends using support, resistance, and volume. Shorter charts may provide detail, but they can also contain more noise.
New readers should begin with basic market structure before adding several indicators. Using similar indicators can create false confirmation without adding new information. Each tool should answer a clear question within the analysis.
On-Chain Dashboards
Etherscan provides Ethereum transactions, fees, addresses, contracts, and network charts. It also allows users to inspect individual wallets and transfers. Direct records can help verify claims circulating on social media.
Dune supports custom dashboards covering applications, users, stablecoins, and other network activity. DefiLlama tracks TVL, fees, revenue, and decentralized exchange activity. Readers should compare definitions because platforms may calculate similar measures differently.
On-chain data can complement price analysis, but it cannot guarantee market direction. One wallet transfer or activity spike may have several explanations. Longer trends usually provide stronger evidence than isolated events.
News and Research Sources
Official Ethereum channels provide primary information about upgrades and roadmap changes. SEC records can confirm ETF decisions and regulatory filings. Company investor pages can confirm treasury announcements and management statements.
Reliable crypto news outlets can add market context and explain technical developments. However, readers should separate confirmed facts from analyst views. Publication dates should also match the actual event dates.
Research reports may provide deeper models, but their incentives still matter. An ETF issuer, treasury company, and trader may emphasize different evidence. Readers should compare these views before accepting a forecast.
FAQ
What Are the Main Factors Influencing Ethereum’s Price Today?
Ethereum responds to Bitcoin trends, market liquidity, network usage, and investor sentiment. ETF flows, staking, token supply, and leverage can also affect price. These factors often interact rather than working alone.
Economic conditions remain important because ETH trades within global risk markets. Interest rates, inflation, and credit conditions can change investor demand. Geopolitical stress can also increase short-term volatility.
Readers should compare several indicators before forming a view. One positive metric may be outweighed by selling elsewhere. Strong analysis explains both supporting and opposing evidence.
Where Can I Find Reliable ETH Price Analysis and Predictions?
Readers can begin with CoinGecko for market data and Ethereum.org for official network information. Etherscan, Dune, and DefiLlama provide several forms of on-chain activity. SEC records can confirm regulatory and ETF developments.
CoinGlass provides derivatives information, including open interest and liquidations. SoSoValue publishes spot crypto ETF flow data. Readers should always check calculation methods and update times.
Reliable analysis explains its sources, assumptions, risks, and invalidation conditions. It does not rely only on one target or personality. Multiple sources can provide a more balanced view.
How Reliable Are Extreme ETH Price Predictions?
Extreme predictions are less reliable when they lack clear methods and market-cap analysis. They also need realistic timelines and measurable adoption assumptions. Guaranteed language should raise immediate concerns.
Even detailed models can fail when liquidity or sentiment changes. Long-term forecasts carry greater uncertainty because small assumptions compound over time. Ranges usually communicate that uncertainty better than one exact number.
Readers should focus on the reasoning behind the target. They should also check the downside case and invalidation point. A confident speaker does not make a weak model reliable.
Do ETH ETF Inflows Guarantee a Higher Price?
No, ETF inflows measure demand through only one investment channel. Selling from other holders can outweigh those purchases during the same period. Derivative pressure can also move ETH against positive fund flows.
Daily figures should be viewed within weekly and monthly trends. One positive session may follow a long period of withdrawals. Stronger conclusions require wider context.
ETF demand still matters because it reflects regulated market participation. However, it should support analysis rather than replace it. Readers should compare flows with price, volume, and market liquidity.
When Is the Best Time to Buy or Sell Ethereum?
There is no universal best time for every investor or trader. Decisions depend on goals, holding periods, risk limits, and market conditions. A clear plan matters more than finding a perfect entry.
Long-term investors may use network growth and broad market cycles. Short-term traders may focus on support, resistance, and liquidity. Both approaches still require risk controls.
Buying because of fear can produce oversized positions. Panic selling can also create poorly planned exits. Readers should avoid making decisions from headlines alone.
Should I Buy Ethereum Based on Whale Buys?
Whale purchases can support sentiment, but they should not guide decisions alone. Large holders can change strategy without warning. Wallet labels may also be incomplete or incorrect.
A large transfer does not always represent a market purchase. It may reflect custody changes, internal movements, or staking activity. Readers should seek confirmation from several sources.
Whale data becomes more useful when combined with wider evidence. Price structure, flows, liquidity, and network activity provide needed context. No single wallet should determine an investment decision.
How Do Liquidations Affect ETH Price?
Liquidations force leveraged positions to close when losses reach required levels. Long liquidations can speed up declines, while short liquidations can strengthen rallies. These events often increase volatility within a short period.
CoinGlass tracks ETH liquidations, open interest, funding rates, and futures activity. Rising leverage can make the market more sensitive to sharp price moves. However, high open interest does not guarantee the next direction.
Liquidation-driven moves can reverse after excess leverage leaves the market. Continued spot buying or selling may extend the move instead. Readers should compare derivatives activity with spot volume and support levels.
Is Tom Lee or BitMine a Price Model?
Tom Lee’s commentary and BitMine’s treasury activity are inputs some traders watch. They can influence sentiment and expectations about institutional ETH demand. However, they do not form a complete forecasting system.
A useful model also needs liquidity analysis, market-cap math, technical levels, and downside risks. It should explain how treasury purchases affect available supply. It must also consider financing methods and possible future sales.
Readers can review BitMine’s official investor communications for confirmed company statements. They should then compare those statements with independent data and wider market conditions. Neither Tom Lee nor BitMine guarantees a specific ETH price.
Explore more
A Brief Introduction to Bitcoin Wallets & Security
AI & Meme Token Presales: How to Read Hype, Fair Launches, and “Best Meme Coin” Searches
Altcoins Explained: Altcoin Season, News, and the Full Coin Map
Bitcoin Basics: Bitcoin ETF, Institutional & Corporate Adoption
Bitcoin Basics: Bitcoin Investing & Valuation
Bitcoin Basics: Bitcoin Mining & Supply Economics