- Tron price remained in a bearish zone below the $0.0180 pivot level against the US Dollar.
- TRX price traded as low as $0.0141 and it is currently correcting higher.
- There is a key bearish trend line forming with resistance near $0.0175 on the 4-hours chart (data feed via Bitfinex).
- The price could correct a few points, but it is likely to struggle near $0.0164 and $0.0175 in the near term.
TRON price is trading in a major downtrend against the US Dollar, similar to bitcoin. TRX price is likely to face a strong selling interest near $0.0180 if it recovers higher.
Tron Price Analysis
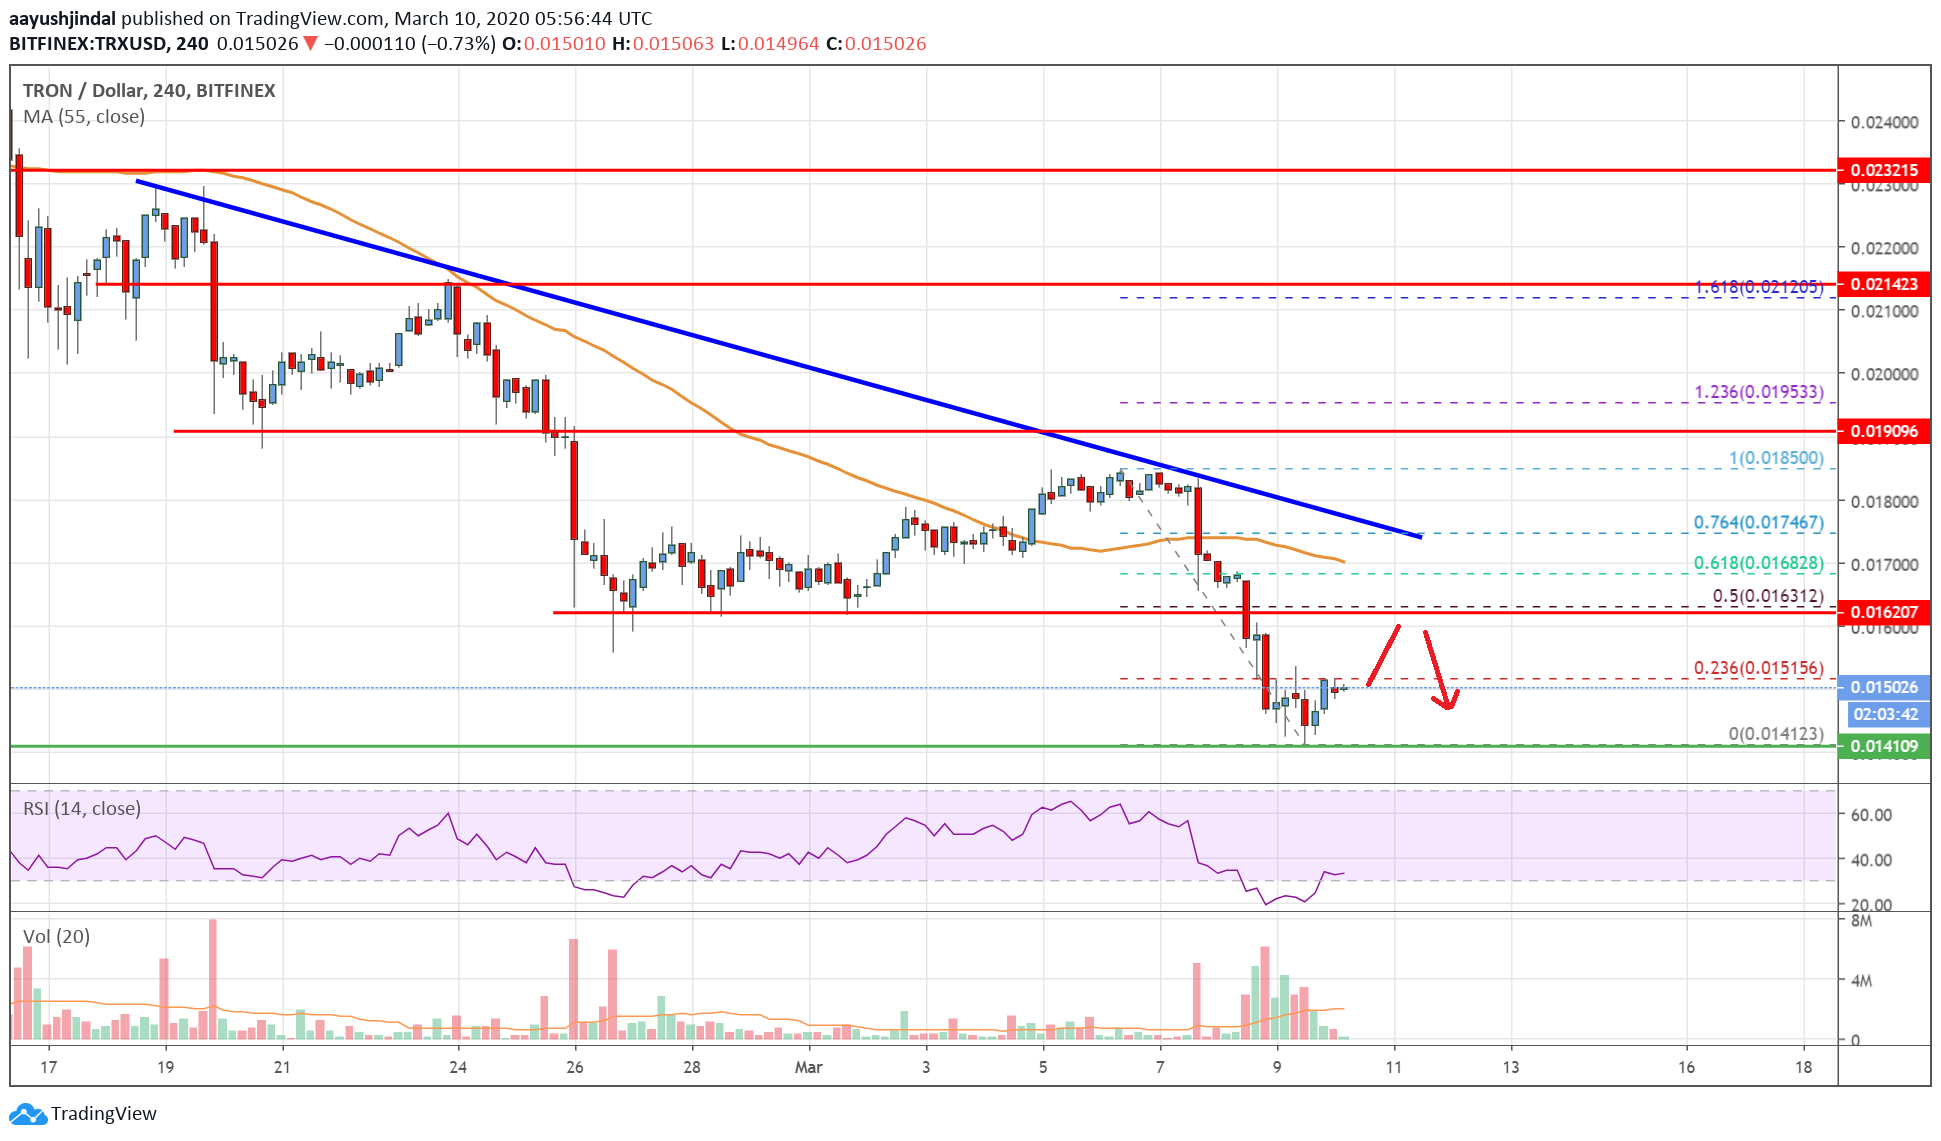
In the past few days, there was a strong decline in TRON price below the $0.0200 pivot level against the US Dollar. TRX price broke many important supports near $0.0180 and the 55 simple moving average (4-hours) to enter a bearish zone.
Finally, the price traded below the $0.0150 support area and traded to a new monthly low at $0.0141. The price is currently correcting higher and trading above $0.0150.
It is testing the 23.6% Fibonacci retracement level of the recent decline from the $0.0185 high to $0.0141 low. On the upside, there are a few hurdles visible near the $0.0155 and $0.0160 levels.
The first major resistance is near the $0.0164 level (the recent breakdown zone). The 50% Fibonacci retracement level of the recent decline from the $0.0185 high to $0.0141 low is also near the $0.0162 level.
Moreover, there is a key bearish trend line forming with resistance near $0.0175 on the 4-hours chart. The trend line resistance at $0.1075 is also close to the 55 simple moving average (4-hours).
Therefore, tron price is likely to face a lot of hurdles on the upside near the $0.0175 level and the 55 simple moving average (4-hours). A successful close above the $0.0175 and $0.0180 levels is needed for a strong upward move in the near term.
Conversely, the price might struggle to recover above the $0.0164 and $0.0175 resistance levels. In the mentioned case, the price is likely to resume its decline below the $0.0150 level support.
The chart indicates that TRX price is clearly trading in a downtrend below the $0.0180 and $0.0175 resistance levels. As long as there is no recovery above $0.0180, there is a risk of a larger decline below $0.0150.
Technical Indicators
4 hours MACD – The MACD for TRX/USD is now losing momentum in the bearish zone.
4 hours RSI – The RSI for TRX/USD is recovering and it could move towards the 40 level.
Key Support Levels – $0.0150 and $0.0145.
Key Resistance Levels – $0.0164, $0.0175 and $0.0180.
