- Tron price started a fresh decline after it failed to surpass the $0.0160 resistance against the US Dollar.
- TRX price is now trading well below the $0.0142 and $0.0145 resistance levels.
- There was a break below a major bullish trend line with support near $0.0140 on the 4-hours chart (data feed via Bitfinex).
- The bears are likely to gain momentum if there is a clear break below the $0.0132 support.
TRON price is showing a few bearish signs against the US Dollar and bitcoin. TRX price remains at a risk of more losses below the $0.0132 and $0.0130 support levels.
Tron Price Analysis
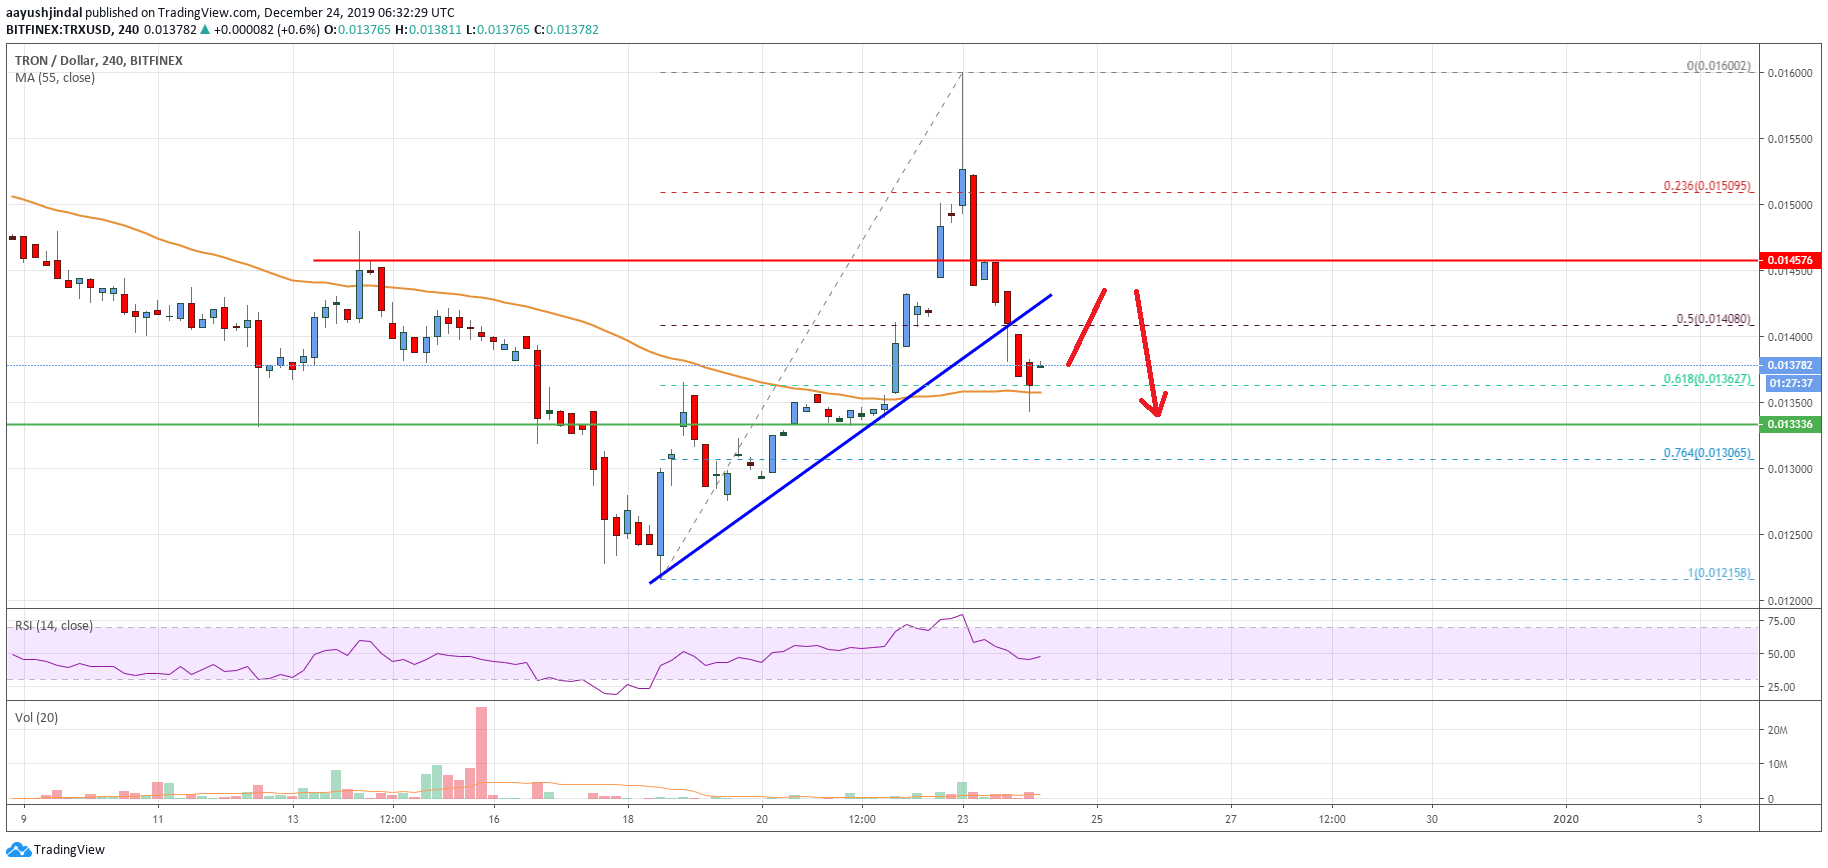
In the past few days, TRON price started a decent upward move above the $0.0132 resistance against the US Dollar. Moreover, TRX price climbed above the $0.0150 resistance and the 55 simple moving average (4-hours).
However, the price struggled to continue higher above $0.0160. A high was formed near $0.0160 and the price started another bearish wave. There was a break below the $0.0145 support area.
Besides, the price broke the 50% Fibonacci retracement level of the upward move from the $0.0121 low to $0.0160 high. More importantly, there was a break below a major bullish trend line with support near $0.0140 on the 4-hours chart.
The pair is now trading below the $0.0135 level and the 55 simple moving average (4-hours). An immediate support is near the $0.0132 level. The next major support is near the $0.0130 level.
Additionally, the 76.4% Fibonacci retracement level of the upward move from the $0.0121 low to $0.0160 high is also near the $0.0130 level to provide support.
If there is a downside break below the $0.0130 support, tron price could continue to decline. The next major support is near the $0.0125 level, followed by the $0.0120 swing low.
On the upside, there are many hurdles for the bulls, starting with $0.0140. If the price breaks the $0.0140 level, it could test the $0.0145 resistance area. The next major hurdle for the bulls is seen near the $0.0150 level, above which the next stop might be $0.0160.
The chart indicates that TRX price is trading in a bearish zone below the $0.0145 and $0.0140 levels. Therefore, there are high chances of more losses below the $0.0132 and $0.0130 support levels.
Technical Indicators
4 hours MACD – The MACD for TRX/USD is gaining momentum in the bearish zone.
4 hours RSI – The RSI for TRX/USD is currently declining and it is now well below the 50 level.
Key Support Levels – $0.0132 and $0.0130.
Key Resistance Levels – $0.0140, $0.0145 and $0.0150.