
- Tron price corrected lower after trading towards the $0.0230 resistance against the US Dollar.
- TRX price is currently trading nicely above the $0.0188 and $0.0178 support levels.
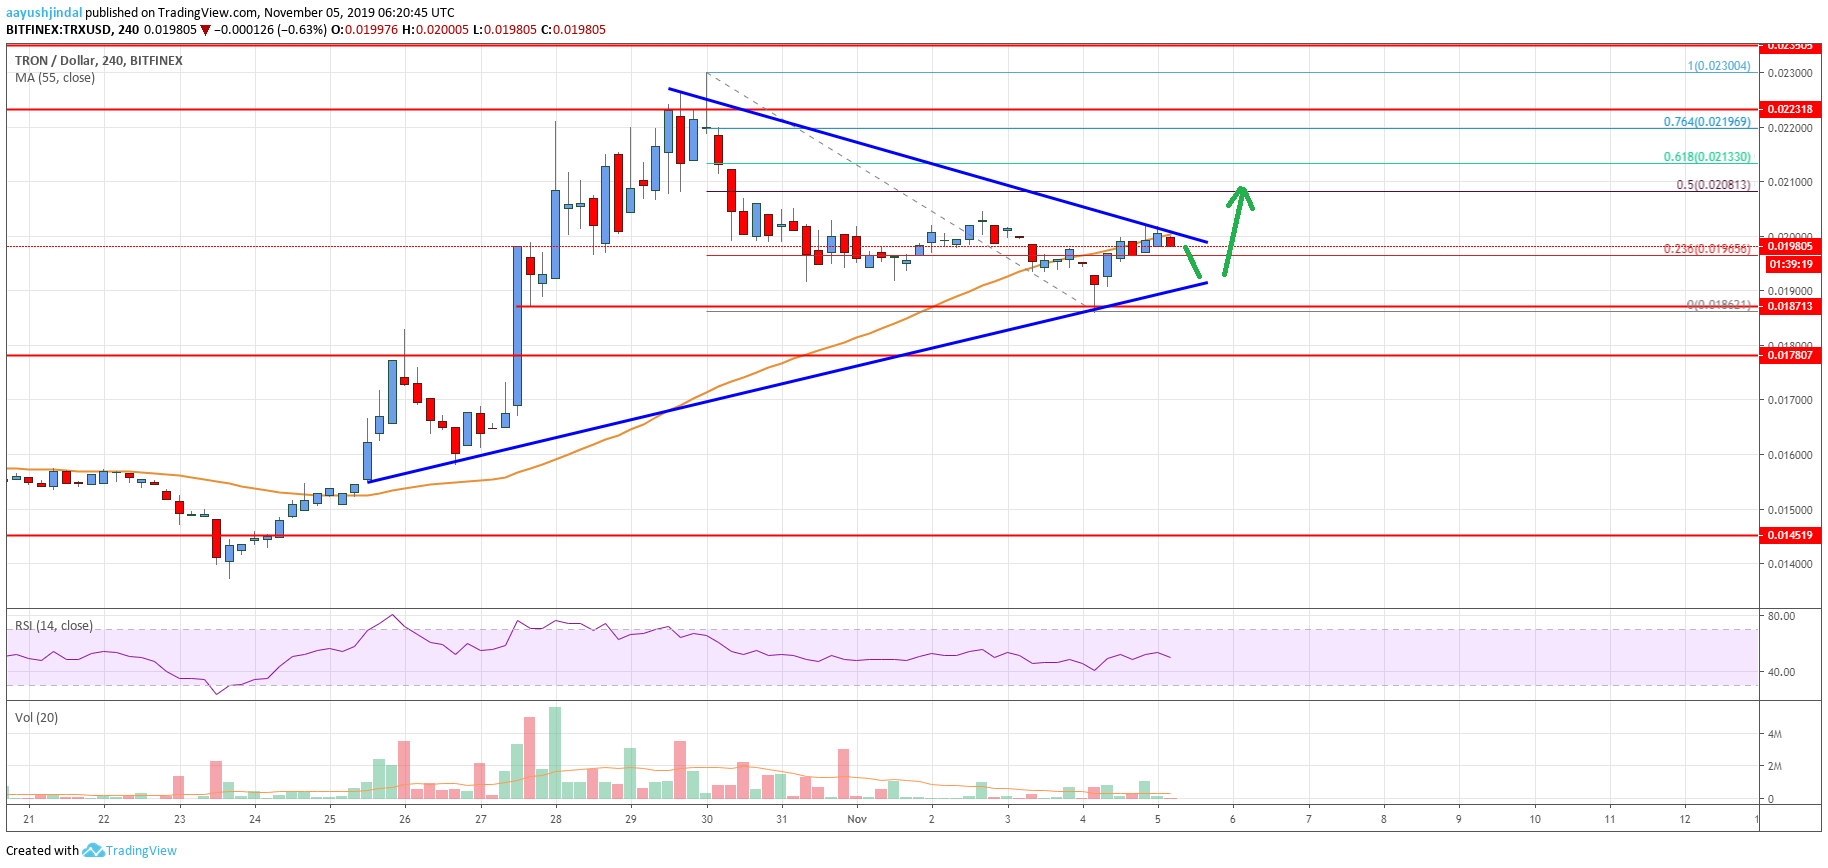
- There is a key contracting triangle forming with resistance near $0.0202 on the 4-hours chart (data feed via Bitfinex).
- The price could continue to rise once it settles above the $0.0200 and $0.0208 resistance levels.
TRON price is consolidating above key supports against the US Dollar and bitcoin. TRX price is likely to start a fresh increase once it breaks the $0.0208 resistance.
Tron Price Analysis
This past week, TRON price followed a bullish path above the $0.0200 resistance area against the US Dollar. Moreover, TRX price even surged above the $0.0210 and $0.0220 resistance levels.
Finally, the price settled above the 55 simple moving average (4-hours) and traded as high as $0.0230. Later, the price started a downside correction below the $0.0215 and $0.0205 support levels.
Tron even declined below the $0.0200 support area. However, the $0.0188 level acted as a strong support. A low was formed near $0.0187 and the price is currently climbing higher. Additionally, it surpassed the 23.6% Fibonacci retracement level of the recent decline from the $0.0230 high to $0.0186 low.
At the outset, there is a key contracting triangle forming with resistance near $0.0202 on the 4-hours chart. If there is an upside break, an immediate resistance is near the $0.0208 level.
Besides, the 50% Fibonacci retracement level of the recent decline from the $0.0230 high to $0.0186 low is near the $0.0208 level to act as a hurdle for the bulls. Therefore, a successful close above the $0.0208 resistance could set the pace for more upsides.
The next key resistance for tron is near the $0.0220 level, above which the price may perhaps rise towards the $0.0235 and $0.0240 resistance levels.
Conversely, the price could break the triangle support near the $0.0190 level. The main supports are near the $0.0188 level, below which the price could correct further towards the $0.0178 level. Any further losses might lead TRX towards the $0.0160 level.
The chart indicates that TRX price is showing a lot of positive signs above the $0.0188 support area. Therefore, there are high chances of an upside break above the $0.0200 and $0.0208 resistance levels. In the mentioned case, the price could rise towards the $0.0235 and $0.0240 levels.
Technical Indicators
4 hours MACD – The MACD for TRX/USD is slowly gaining momentum in the bullish zone.
4 hours RSI – The RSI for TRX/USD is currently near the 50 level, with a minor bearish angle.
Key Support Levels – $0.0188 and $0.0178.
Key Resistance Levels – $0.0200, $0.0208 and $0.0220.


Leave a Reply
You must be logged in to post a comment.