- Tron price is trading in a bearish zone below the main $0.0800 resistance against the US Dollar.
- TRX price is now trading below $0.0750 and the 55 simple moving average (4-hours).
- There was a break below a key bullish trend line with support near $0.0780 on the 4-hours chart (data feed via Bitfinex).
- The pair could continue to move down unless there is a clear break above $0.0750 and $0.0850.
TRON price is showing bearish signs below $0.0800 against the US Dollar, similar to bitcoin. TRX price must surpass $0.0750 and $0.0850 to start a steady increase.
Tron Price Analysis
After testing the $0.0575 support zone, tron price started an upside correction against the US Dollar. TRX price recovered above the $0.0650 and $0.0700 resistance levels.
However, the price failed to gain momentum above $0.0840. The bulls made two attempts, but they failed. The recent high was formed near $0.0831 before the price started a fresh decline. It broke the $0.0750 support level and the 55 simple moving average (4-hours).
There was a break below a key bullish trend line with support near $0.0780 on the 4-hours chart. The pair even traded below $0.0700 and it tested the $0.0675. A low is formed near $0.0673 and the price is now consolidating losses.
It is testing the 23.6% Fib retracement level of the recent decline from the $0.0831 swing high to $0.0673 low. The first major resistance on the upside is near the $0.0750 level and the 55 simple moving average (4-hours).
The 50% Fib retracement level of the recent decline from the $0.0831 swing high to $0.0673 low is also near $0.0750. The next major resistance is near $0.0800, above which the price could attempt a key upside break above the $0.0850 level.
On the downside, an immediate support is near the $0.0675 level. The next key support is near the $0.0650 level, below which there is a risk of a drop towards the $0.0550 support.
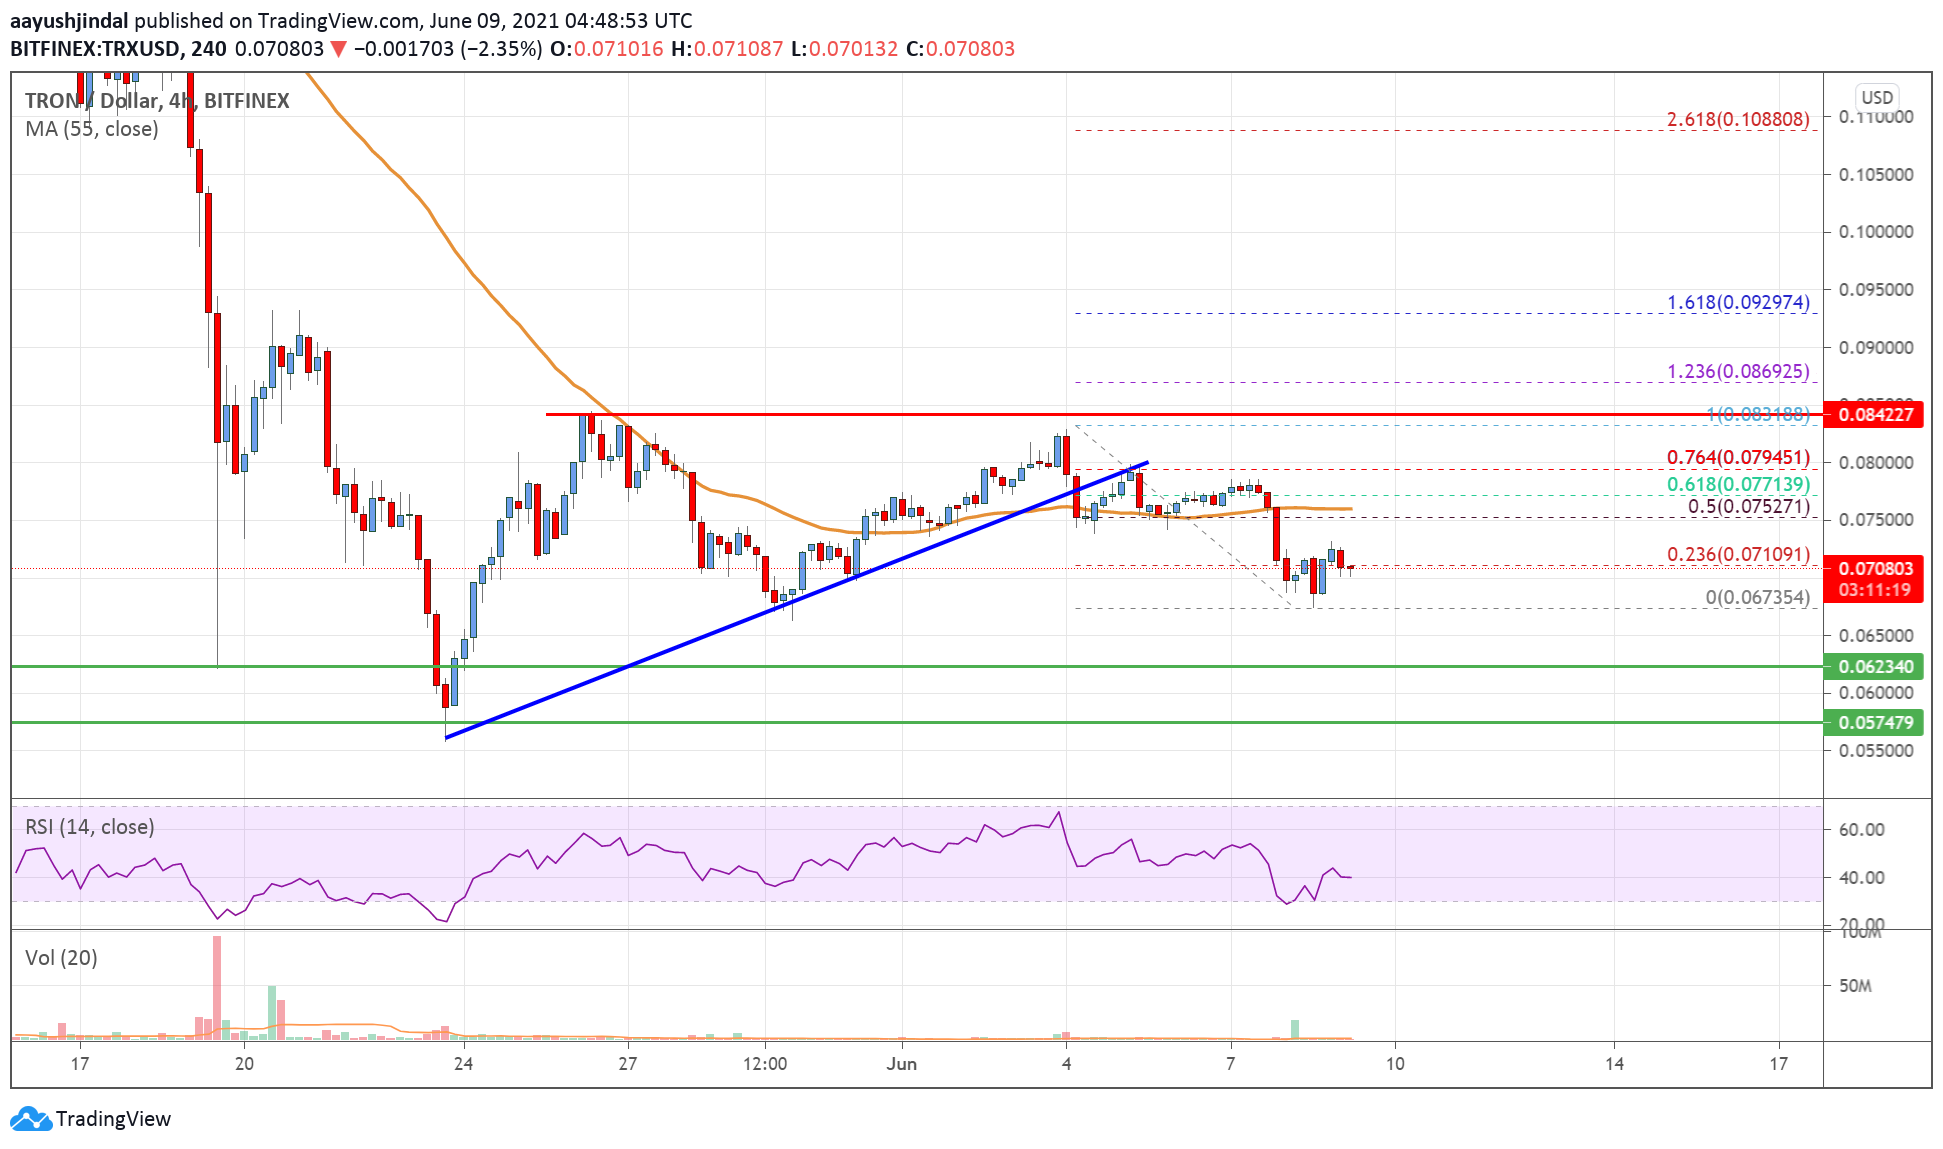
The chart indicates that TRX price is trading well below $0.0750 and the 55 simple moving average (4-hours). Overall, the price could continue to move down unless there is a clear break above $0.0750 and $0.0850.
Technical Indicators
4 hours MACD – The MACD for TRX/USD is slowly losing momentum in the bearish zone.
4 hours RSI – The RSI for TRX/USD is now below the 50 level.
Key Support Levels – $0.0650 and $0.0550.
Key Resistance Levels – $0.0750, $0.0800 and $0.0850.
