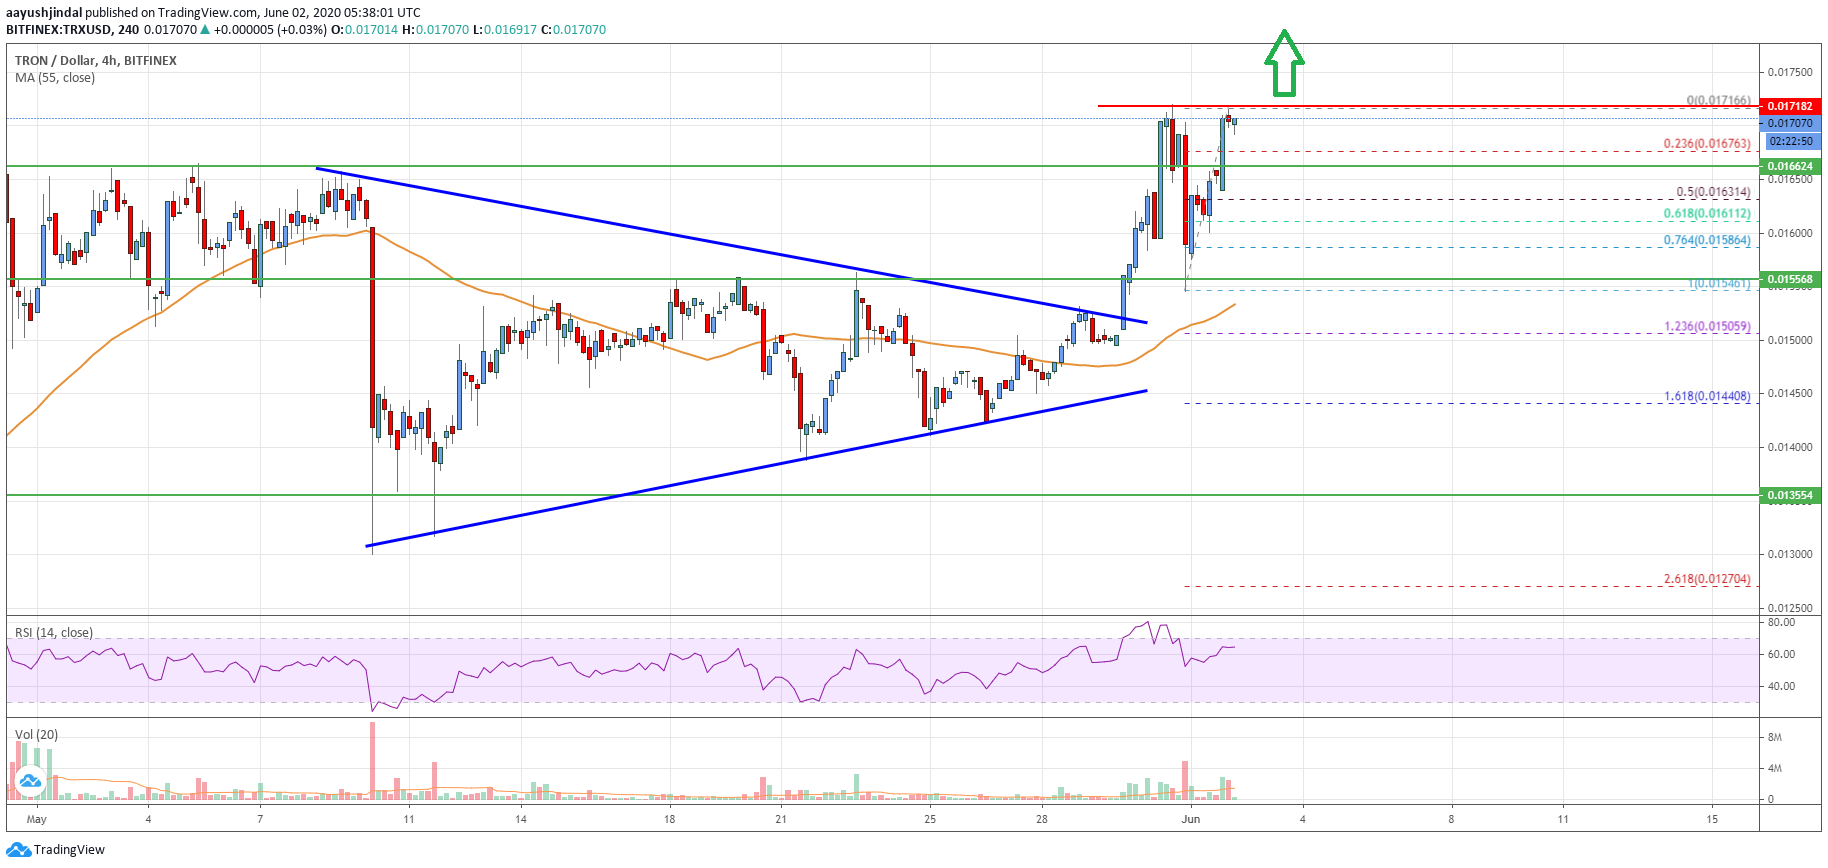
- Tron price is trading in a positive zone above the $0.0160 resistance zone against the US Dollar.
- TRX price is facing a short term hurdle near the $0.0172 level.
- There was a break above a crucial contracting triangle with resistance near $0.0152 on the 4-hours chart (data feed via Bitfinex).
- The price might accelerate higher towards $0.0185 and $0.0200 if it breaks the $0.0200 barrier.
TRON price is gaining bullish momentum against the US Dollar, similar to bitcoin. TRX price is likely to surpass $0.0175 and continue higher towards the $0.0200 level.
Tron Price Analysis
In the past few days, TRON price followed a bullish path above the $0.0145 and $0.0150 resistance levels against the US Dollar. TRX price even settled nicely above the $0.0155 level and the 55 simple moving average (4-hours).
During the rise, there was a break above a crucial contracting triangle with resistance near $0.0152 on the 4-hours chart. The price is now trading comfortably above the $0.0165 level. Moreover, it is testing the $0.0172 resistance zone.
An initial support is near the $0.0166 level. It is close to the 23.6% Fibonacci retracement level of the recent rise from the $0.0154 low to $0.0171 high. If there are more downsides, the price could test $0.0162.
The 50% Fibonacci retracement level of the recent rise from the $0.0154 low to $0.0171 high is also likely to act as a strong support. The main uptrend support is visible near the $0.0155 level (the last major breakout zone).
Any further losses could lead the price towards the $0.0152 support or the 55 simple moving average (4-hours). Conversely, the price is likely to continue higher above the $0.0172 level.
An initial hurdle on the upside is near the $0.0180 level. The first key resistance is near the $0.0188 level, above which the bulls are likely to aim a test of the all-important $0.0200 resistance zone.

The chart indicates that TRX price is clearly trading in a strong bullish zone above $0.0165. Therefore, there are chances of a sustained upward move towards the $0.0188 and $0.0200 resistance levels. If not, dips towards the $0.0155 support zone could find a solid buying interest in the near term.
Technical Indicators
4 hours MACD – The MACD for TRX/USD is currently gaining momentum in the bullish zone.
4 hours RSI – The RSI for TRX/USD is now well above the 50 level.
Key Support Levels – $0.0162 and $0.0155.
Key Resistance Levels – $0.0172, $0.0180 and $0.0200.


Leave a Reply
You must be logged in to post a comment.