- Tron price is down over 15% and it broke the $0.0920 support against the US Dollar.
- TRX price is now trading below $0.0900 and the 55 simple moving average (4-hours).
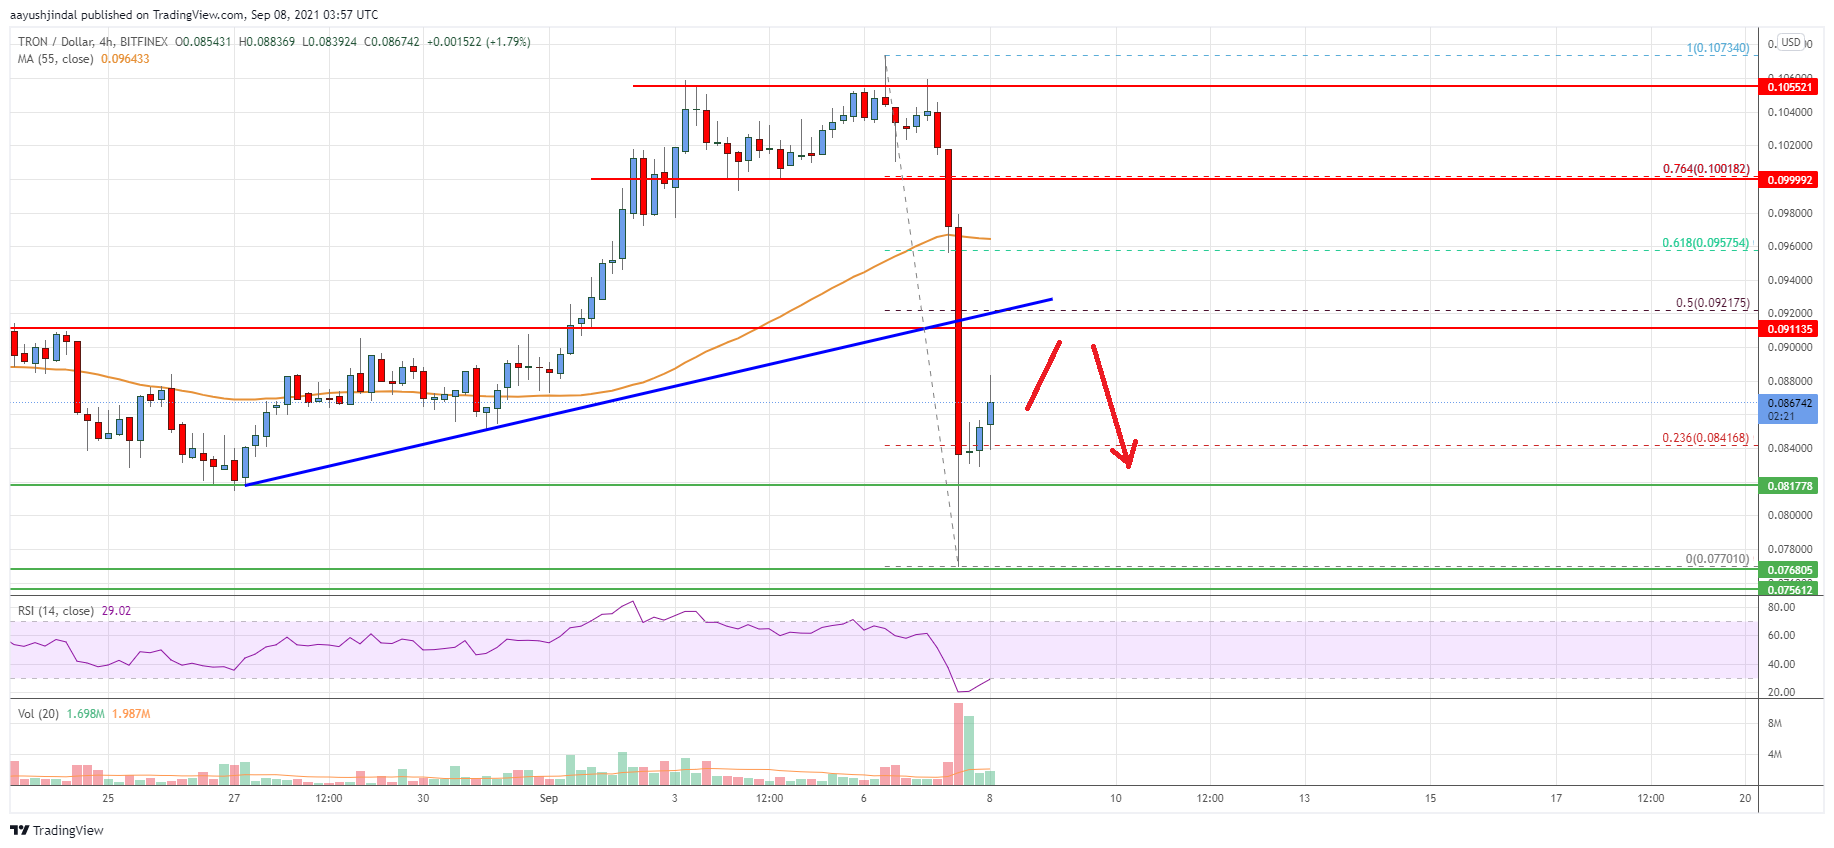
- There was a break below a key bullish trend line with support near $0.0920 on the 4-hours chart (data feed via Bitfinex).
- The pair must clear the $0.0900 and $0.0920 resistance levels to move into a positive zone.
TRON price is declined heavily from well above $0.1000 against the US Dollar, similar to bitcoin. TRX price is likely to resume its decline unless it surpasses $0.0900.
Tron Price Analysis
After struggling to clear the key $0.1050 resistance, tron price started a fresh decline against the US Dollar. TRX price broke the $0.0920 support zone to move into a bearish zone.
The pair even broke the $0.0900 support and the 55 simple moving average (4-hours). There was a break below a key bullish trend line with support near $0.0920 on the 4-hours chart. It dived below the $0.0850 and $0.0820 levels. A low is formed near $0.0770 and it is now correcting losses.
There was a break above the $0.0820 resistance zone. The price traded above the 23.6% Fib retracement level of the recent decline from the $0.1073 swing high to $0.0720 swing low. An initial resistance is near the $0.0890 level.
The first major resistance is near the $0.0900 level. The main resistance is now forming near the $0.0920 level. It is near the 50% Fib retracement level of the recent decline from the $0.1073 swing high to $0.0720 swing low.
Any more gains could set the pace for a move towards the main $0.1000 resistance zone. On the downside, an initial support is near the $0.0840 level. The main support is now forming near $0.0820. Any more losses might call for a sharp decline towards the $0.0780 level. The next major support below $0.0780 could be near the $0.0720 zone.

The chart indicates that TRX price is now trading below $0.0900 and the 55 simple moving average (4-hours). Overall, the price must clear the $0.0900 and $0.0920 resistance levels to move into a positive zone.
Technical Indicators
4 hours MACD – The MACD for TRX/USD is slowly gaining momentum in the bullish zone.
4 hours RSI – The RSI for TRX/USD is now well below the 50 level.
Key Support Levels – $0.0820 and $0.0780.
Key Resistance Levels – $0.0900, $0.0920 and $0.1000.


Leave a Reply
You must be logged in to post a comment.