
- Tron price is slowly moving higher towards the $0.0550 resistance against the US Dollar.
- TRX price is now trading above the $0.0500 support and the 55 simple moving average (4-hours).
- There is a key rising channel forming with support near $0.0485 on the 4-hours chart (data feed via Bitfinex).
- The pair could start a fresh rally if it clears the $0.0535 and $0.0550 resistance levels in the near term.
TRON price is showing positive signs above $0.0500 against the US Dollar, similar to bitcoin. TRX price must settle above $0.0550 to continue higher in the near term.
Tron Price Analysis
In the past few days, there was a steady increase in tron price above the $0.0450 pivot level against the US Dollar. TRX price even broke the $0.0500 resistance level to move further into a bullish zone.
It is now trading above the $0.0500 support and the 55 simple moving average (4-hours). The price is now facing hurdles near the $0.0535 and $0.0540 levels. A high is formed near $0.0537 and the price is now consolidating gains.
An initial support is near the $0.0500 level and the 55 simple moving average (4-hours). The 23.6% retracement level of the recent increase from the $0.0380 low to $0.0537 high is also near $0.0500.
There is also a key rising channel forming with support near $0.0485 on the 4-hours chart. If there is a downside break below the channel support, the pair could dip towards the $0.0450 support. The 50% retracement level of the recent increase from the $0.0380 low to $0.0537 high is also near $0.0450.
Any more losses might call for a test of the $0.0410 support. On the upside, the price is facing hurdles near the $0.0535 and $0.0550 levels. Therefore, a clear break above the $0.0535 and $0.0550 resistance levels could start a strong increase. The next major resistance is near $0.0600, above which the price could rally towards $0.0680.
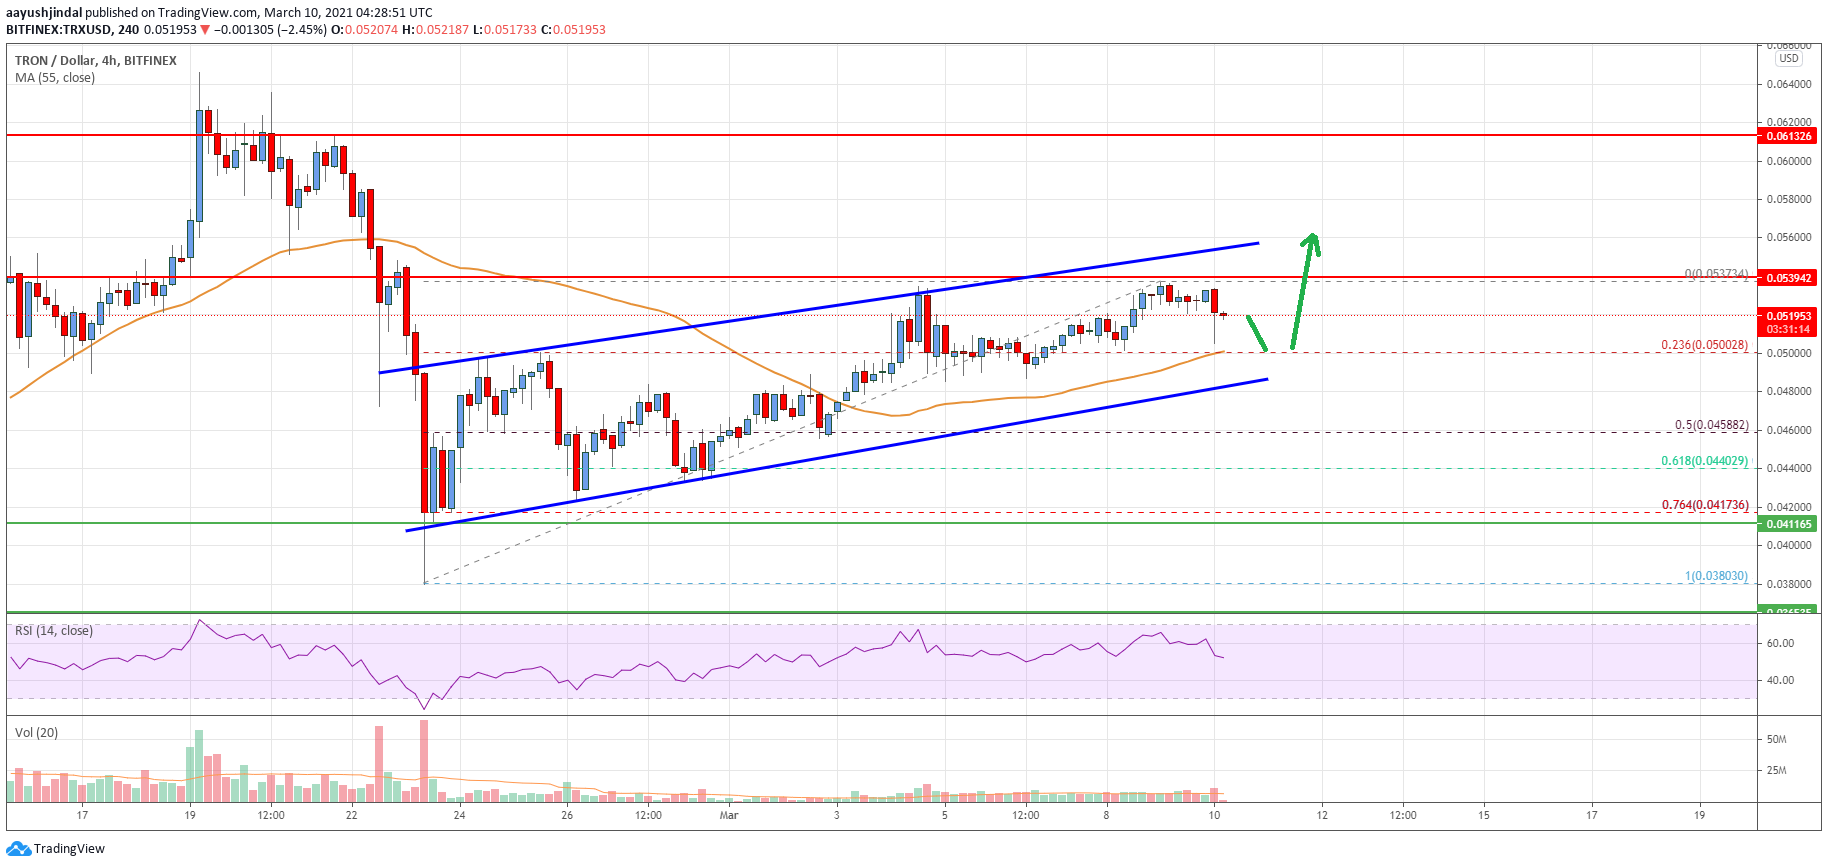
The chart indicates that TRX price is clearly trading above the $0.0500 support and the 55 simple moving average (4-hours). Overall, the price could start a fresh rally if it clears the $0.0535 and $0.0550 resistance levels in the near term.
Technical Indicators
4 hours MACD – The MACD for TRX/USD is slowly gaining momentum in the bullish zone.
4 hours RSI – The RSI for TRX/USD is well above the 50 level.
Key Support Levels – $0.0500 and $0.0485.
Key Resistance Levels – $0.0535, $0.0550 and $0.0600.


Leave a Reply
You must be logged in to post a comment.