- Tron price started a fresh decline from well above $0.0600 against the US Dollar.
- TRX price is now trading well below $0.0550 and the 55 simple moving average (4-hours).
- There is a major bearish trend line forming with resistance near $0.0530 on the 4-hours chart (data feed via Bitfinex).
- The pair could correct higher, but the bears are likely to remain active near $0.0530 and $0.0550.
TRON price is slowly moving lower below $0.0500 against the US Dollar, similar to bitcoin. TRX price remains at a risk of a larger decline below $0.0500 in the near term.
Tron Price Analysis
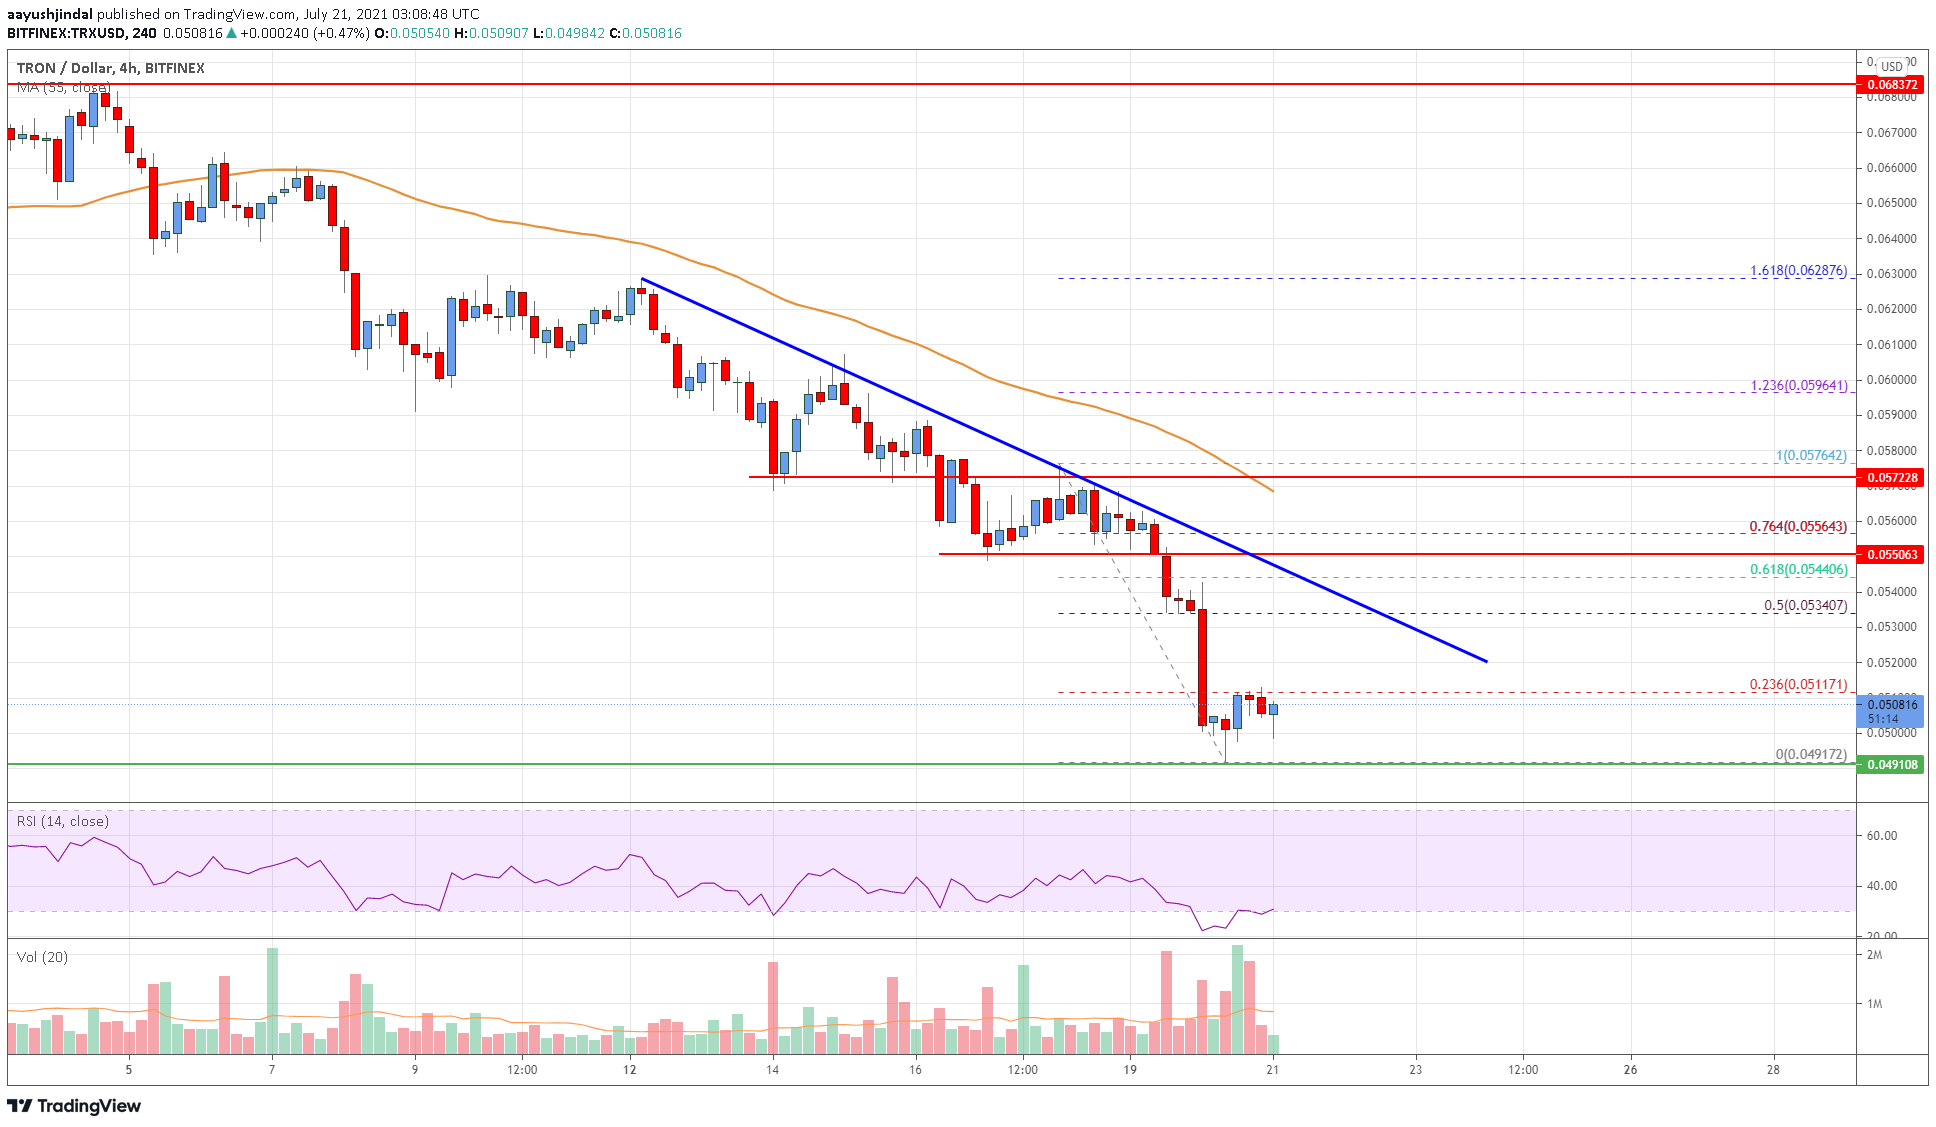
After struggling to clear the $0.0600 resistance zone, tron price started a fresh decline against the US Dollar. TRX price broke many important supports near $0.0580 and $0.0550 to move into a bearish zone.
There was also a close below the $0.0550 support level and the 55 simple moving average (4-hours). The price even spiked below the $0.0500 level. It traded as low as $0.0491 and the price is now consolidating losses.
An initial resistance on the upside is near the $0.0512 level. It is close to the 23.6% Fib retracement level of the recent decline from the $0.0576 high to $0.0491 low. The first major resistance is near the $0.0520 level.
There is also a major bearish trend line forming with resistance near $0.0530 on the 4-hours chart. The trend line coincides with the 50% Fib retracement level of the recent decline from the $0.0576 high to $0.0491 low. The main resistance is now forming near the $0.0550 level.
A clear break above the $0.0520 and $0.0550 resistance levels could start a major increase. The next major resistance is near $0.0575 and the 55 simple moving average (4-hours).
An immediate support on the downside is near the $0.0500 level. A downside break below the $0.0500 support zone could set the pace for a larger decline. The next major support is near the $0.0480 level. Any more losses might call for a drop towards the $0.0450 zone.

The chart indicates that TRX price is now trading well below the $0.0550 resistance and the 55 simple moving average (4-hours). Overall, the price could correct higher, but the bears are likely to remain active near $0.0530 and $0.0550.
Technical Indicators
4 hours MACD – The MACD for TRX/USD is slowly losing momentum in the bearish zone.
4 hours RSI – The RSI for TRX/USD is now well below the 50 level, with a recovery angle.
Key Support Levels – $0.0500 and $0.0450.
Key Resistance Levels – $0.0520, $0.0530 and $0.0550.


Leave a Reply
You must be logged in to post a comment.