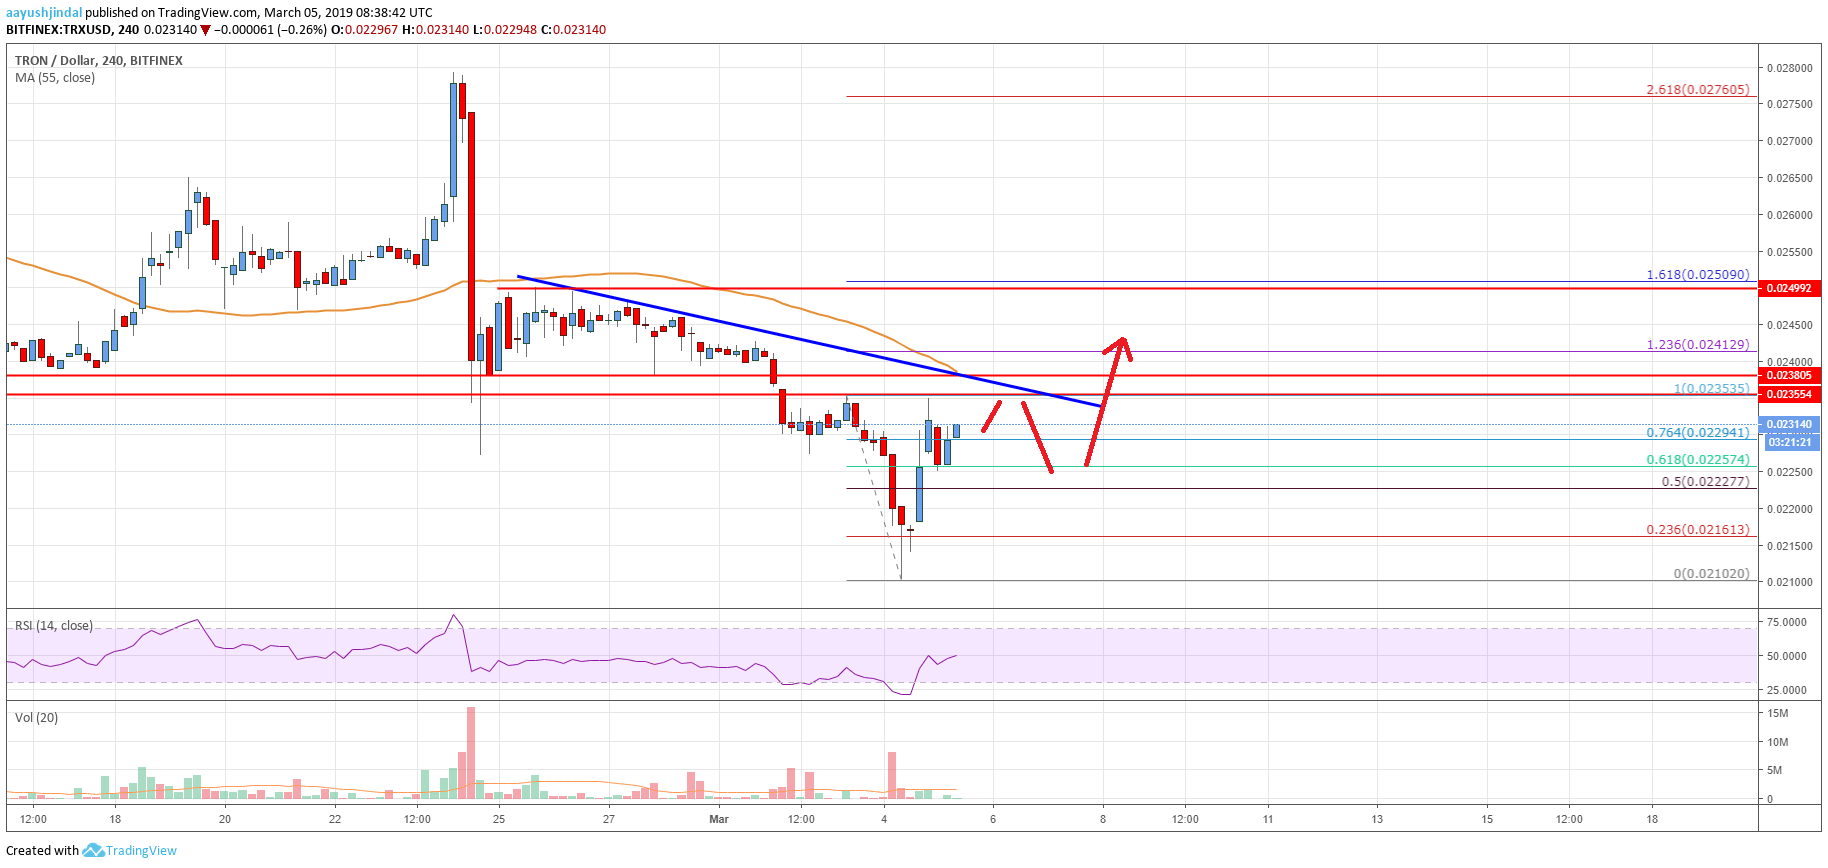
- Tron price declined heavily after it broke the $0.0240 and $0.0235 supports against the US Dollar.
- TRX traded towards the $0.0200 support zone, tested $0.0210, and later bounced back.
- There is a major bearish trend line in place with resistance at $0.0238 on the 4-hours chart (data feed via Bitfinex).
- The price must break the $0.0238 and $0.0240 resistance levels to start an upward move in the near term.
TRON price declined heavily below key supports against the US Dollar and bitcoin. TRX tested the $0.0210 level and it recently bounced back above the $0.0225 resistance level.
Tron Price Analysis
After a sharp drop from the $0.0280 high, TRON price formed support near the $0.0240 level against the US Dollar. However, the TRX/USD pair failed to hold the $0.0240 support and declined heavily. It broke the $0.0235 and $0.0220 support levels. There was even a close below the $0.0235 level and the 55 simple moving average (4-hours). It traded close to the $0.0210 level and formed a new monthly low at $0.0210.
Later, the price started a solid recovery and traded above $0.0230. Buyers pushed the price above the 61.8% Fibonacci retracement level of the last decline from the $0.0235 high to $0.0210 low. However, the price is facing a solid resistance near the $0.0238 and $0.0240 level. There is also a major bearish trend line in place with resistance at $0.0238 on the 4-hours chart. At the outset, the price is trading above the 76.4% Fibonacci retracement level of the last decline from the $0.0235 high to $0.0210 low.
Therefore, there are chances of an upside break above the $0.0235 swing high and the $0.0238 resistance. Once there is a close above the trend line, the price could trade above $0.0240. The next key resistance is near the $0.0250. It represents the 1.618 Fib extension level of the last decline from the $0.0235 high to $0.0210 low. On the other hand, if the price fails to move above $0.0240, it could resume its decline. An initial support is at $0.0225, below which the price may revisit the $0.0210 support.

The chart indicates that TRX price recovered nicely from the $0.0210 swing low. Having said that, a proper close above the $0.0240 level and the 55 simple moving average (4-hours) is needed for more gains. If buyers succeed, the price is likely to move higher towards the $0.0250 and $0.0265 resistance levels.
Technical Indicators
4 hours MACD – The MACD for TRX/USD just moved into the bullish zone, with a positive bias.
4 hours RSI – The RSI for TRX/USD is about to move above the 50 level, with a bullish angle.
Key Support Levels – $0.0225 and $0.0210
Key Resistance Levels – $0.0235, $0.0238 and $0.0240.


Leave a Reply
You must be logged in to post a comment.