XRP trades between $1.40 and $1.50 as liquidity builds on both sides, with traders watching for a breakout move.
XRP is moving between $1.40 and $1.50 as traders wait for a clear break. The token has stayed flat while Bitcoin moved higher, which has increased focus on nearby liquidity levels.
Analysts are watching both sides of the range, as a break above $1.50 or below $1.40 could shape the next short-term move.
XRP Builds Pressure Between Key Levels
XRP has traded sideways on the daily chart, with price near $1.39. The move has kept the token close to a key support area. It has also left traders waiting for stronger direction.
Crypto trader Ted said XRP has been flat despite Bitcoin’s upward move. He wrote, “XRP has been going sideways despite the BTC upward move.”
The comment points to a gap between XRP and broader market strength.
$XRP has been going sideways despite BTC upward move.
This sideways action has led both bulls and bears to get aggressive.
On the upside, a decent chunk of short-side liquidity has formed above the $1.5 level.
On the downside, there's a decent liquidity cluster below the $1.4… pic.twitter.com/QHg3WglTaL
— Ted (@TedPillows) April 26, 2026
Ted also said both bulls and bears have become more active. This often happens when price stays inside a tight range. As a result, liquidity can build on both sides.
The main range now sits between $1.40 and $1.50. A move through either level may bring faster price action. Until then, XRP remains in a tight trading zone.
Liquidity Forms Above $1.50 and Below $1.40
The upside level to watch is $1.50. Ted said a “decent chunk of short-side liquidity” has formed above it.
That means short positions may be at risk if XRP moves higher. A break above $1.50 could force some traders to close bearish positions.
This can add buying pressure in the market. However, price must hold above the level to confirm strength.
The downside level sits below $1.40. Ted said there is a liquidity cluster under that area. Therefore, sellers may target that zone if support weakens.
XRP has been trading close to this lower level. A daily close below $1.40 could increase bearish pressure. It may also shift focus toward the $1.35 support area.
Read Also:
XRP Triangle Tightens as Traders Watch for a Fast Breakout Move Ahead
Chart Signals Show a Neutral Setup
The chart shows XRP below several Fibonacci levels. The first key resistance is near $1.59. This level matches the 0.786 Fibonacci retracement area.
If XRP reclaims $1.59, the next resistance sits near $1.78. After that, traders may watch $1.91 and $2.04. These levels could matter if buying volume improves.
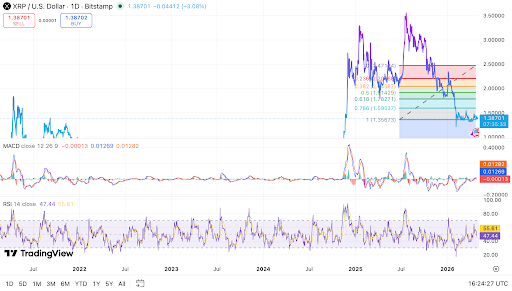
Support remains near $1.35 to $1.40. This range has helped slow the recent decline. Yet a clear break below it could open the path toward $1.25.
Momentum indicators also show a balanced setup. The RSI is near 47.8, which shows neither strong buying nor strong selling. The MACD is close to the zero line, so momentum remains weak.
For now, XRP is caught between two clear liquidity zones. Bulls need a move above $1.50 to gain control. Bears need a break below $1.40 to extend the decline.


Leave a Reply
You must be logged in to post a comment.