- XRP price is attempting a fresh increase from the $0.40 support against the US dollar.
- The price is now trading above $0.480 and the 55 simple moving average (4 hours).
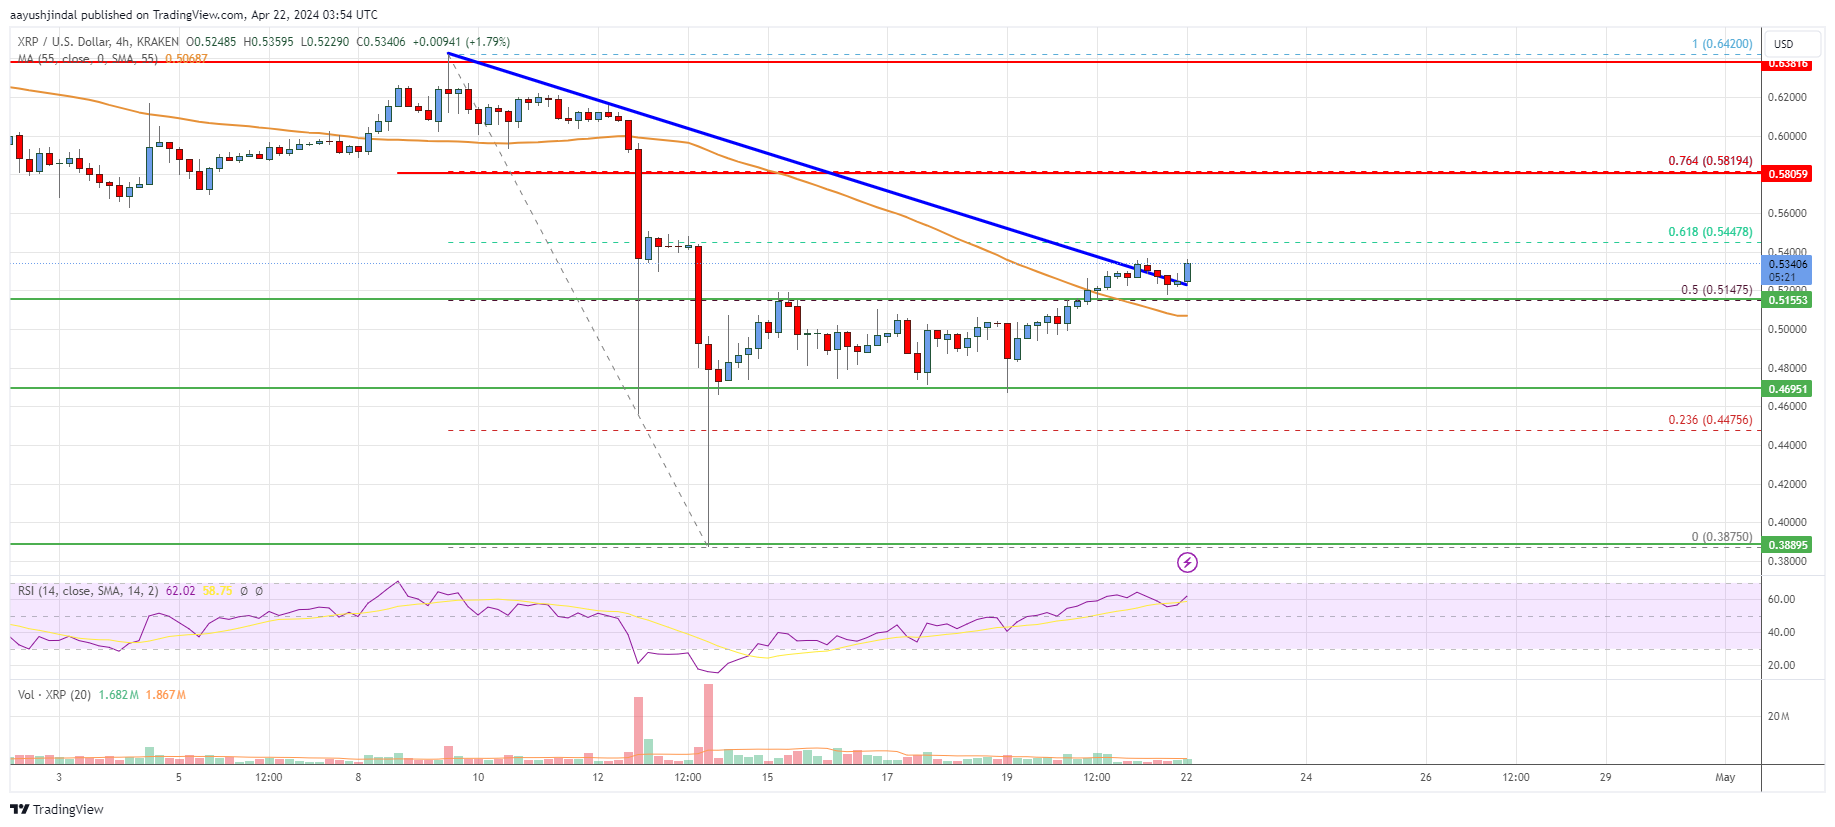
- There was a break above a key bearish trend line with resistance at $0.5150 on the 4-hour chart of the XRP/USD pair (data source from Kraken).
- The pair could continue to rise if it clears the $0.5450 resistance.
XRP price is consolidating above $0.50 against the US Dollar, like Bitcoin. It must stay above the $0.480 support to continue higher in the near term.
XRP Price Analysis
After forming a base above the $0.400 level, XRP price started a fresh increase against the US Dollar. The XRP/USD pair broke the $0.450 and $0.4650 resistance levels to enter a positive zone.
There was a break above a key bearish trend line with resistance at $0.5150 on the 4-hour chart of the XRP/USD pair. The pair even cleared the 50% Fib retracement level of the downward wave from the $0.6420 swing high to the $0.3875 low.
The price is now trading above $0.480 and the 55 simple moving average (4 hours). On the upside, the price is facing resistance near $0.5450. It is near the 61.8% Fib retracement level of the downward wave from the $0.6420 swing high to the $0.3875 low.
The first key resistance is near the $0.580 level. The next major resistance is near the $0.600 level. A clear move above the $0.600 resistance zone might start a strong increase. In the stated case, the price could even surpass the $0.6240 zone and test $0.650. Any more gains might send the price toward the $0.700 resistance.
Initial support on the downside is near the $0.50 level. The next major support is near the $0.480 level. Any more losses could lead the price toward the $0.440 level, below which the price might even test the $0.4250 support zone in the near term.
Looking at the chart, XRP price is now trading above the $0.500 zone and the 55 simple moving average (4 hours). Overall, the price could start a fresh increase above the $0.5450 resistance.
Technical indicators
4 hours MACD – The MACD for XRP/USD is now gaining momentum in the bullish zone.
4 hours RSI (Relative Strength Index) – The RSI for XRP/USD is above the 50 level.
Key Support Levels – $0.50, $0.480, and $0.440.
Key Resistance Levels – $0.5450 and $0.580.