XRP trades near $1.13 as Upbit reserves slip, with the 3-month regression band and $1.26392 resistance in focus
XRP has lately entered a closely watched market zone. Recent data show a slight decline in Upbit reserves. Besides, the token has traded near $1.13467 and remained within reach of a historical three-month upper regression band that has marked prior cycle lows.
Read also:
XRP Dominance Is Holding Key Support-Is Volatility Coming Next?
Upbit XRP Reserves Show Slight Decline
Market data showed that Upbit’s XRP reserve has started to decrease slightly. In past cycles, rising XRP reserves on Upbit often aligned with bearish price action. Falling reserves appeared during stronger recovery periods.
A reserve decline can suggest that fewer XRP tokens sit on the exchange for near-term trading. However, analysts usually track this metric with price action, volume, and momentum indicators before treating it as a clear market signal.
The current decrease remains small, so traders are watching whether the trend continues over the coming sessions. A steady decline in reserves could support a more constructive setup if broader demand also improves.
Upbit's $XRP reserve is decreasing slightly.
In general, periods when Upbit's $XRP reserves increased coincided with periods of bearish trend.
Conversely, when Upbit's reserves decreased, $XRP showed a bullish rally.
Although subtle, the reserves are showing signs of a slight… pic.twitter.com/lddeLRCdPd
— CW (@CW8900) June 9, 2026
XRP Historical Bottom Zone Comes Into Focus
XRP moved from about $1.45 in April to nearly $1.04 in June, placing the asset close to a historical area watched by market analysis. The three-month upper regression band remains in focus because it has appeared near previous cycle low regions.
This zone does not guarantee a reversal, but it gives traders a reference point for comparing the current market structure with earlier XRP cycles.
When price approaches long-watched regression areas, market participants often monitor reaction strength before adjusting expectations.
So close 🤏 yet so far 🔭
From $1.45 in April to $1.04 in June, $XRP still has the historical 3 month upper regression band that has marked all prior cycle lows in its sights.
Reminder: we are now in the territory where placing all our eggs in one basket is a risk. RR = ✅️ https://t.co/EdmWiTRHuH pic.twitter.com/OHG31BN7Oa
— 🇬🇧 ChartNerd 📊 (@ChartNerdTA) June 9, 2026
Risk management has also become part of the discussion as XRP trades near this lower range. Concentrated exposure can increase portfolio risk during volatile periods, especially when the daily trend remains weak.
XRP Price Stays Below Key Resistance
On the daily Bitstamp chart, XRP/USD traded around $1.13467, down about 2.82% during the session. The token remains below the former Fibonacci support at $1.26392, which now stands as the first major resistance for any recovery attempt.
The broader chart structure remains weak after XRP formed lower highs and lower lows following rejection near $2.87918.
A stronger recovery would require XRP to reclaim $1.26392, then challenge the $1.60959 Fibonacci level before attempting higher zones near $1.88095 and $2.07155.
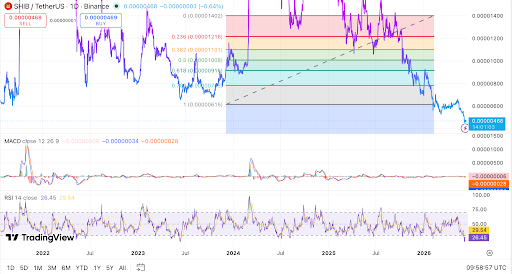
The downside area to watch sits around $1.13 to $1.10, where buyers may try to defend the current range. If that area fails, XRP could test the psychological $1.00 level, followed by deeper support near $0.95 to $0.90.
Momentum indicators still show caution across the daily timeframe. The RSI remains near 31.12, close to oversold territory, while the MACD line stays below the signal line with a negative reading.
A move back above RSI 30 may support a relief bounce, although a stronger momentum shift would require progress toward the 50 area. Until XRP closes above $1.26392, the chart remains under pressure despite the slight decline in Upbit reserves and the approach toward a historical bottom zone.


Leave a Reply
You must be logged in to post a comment.