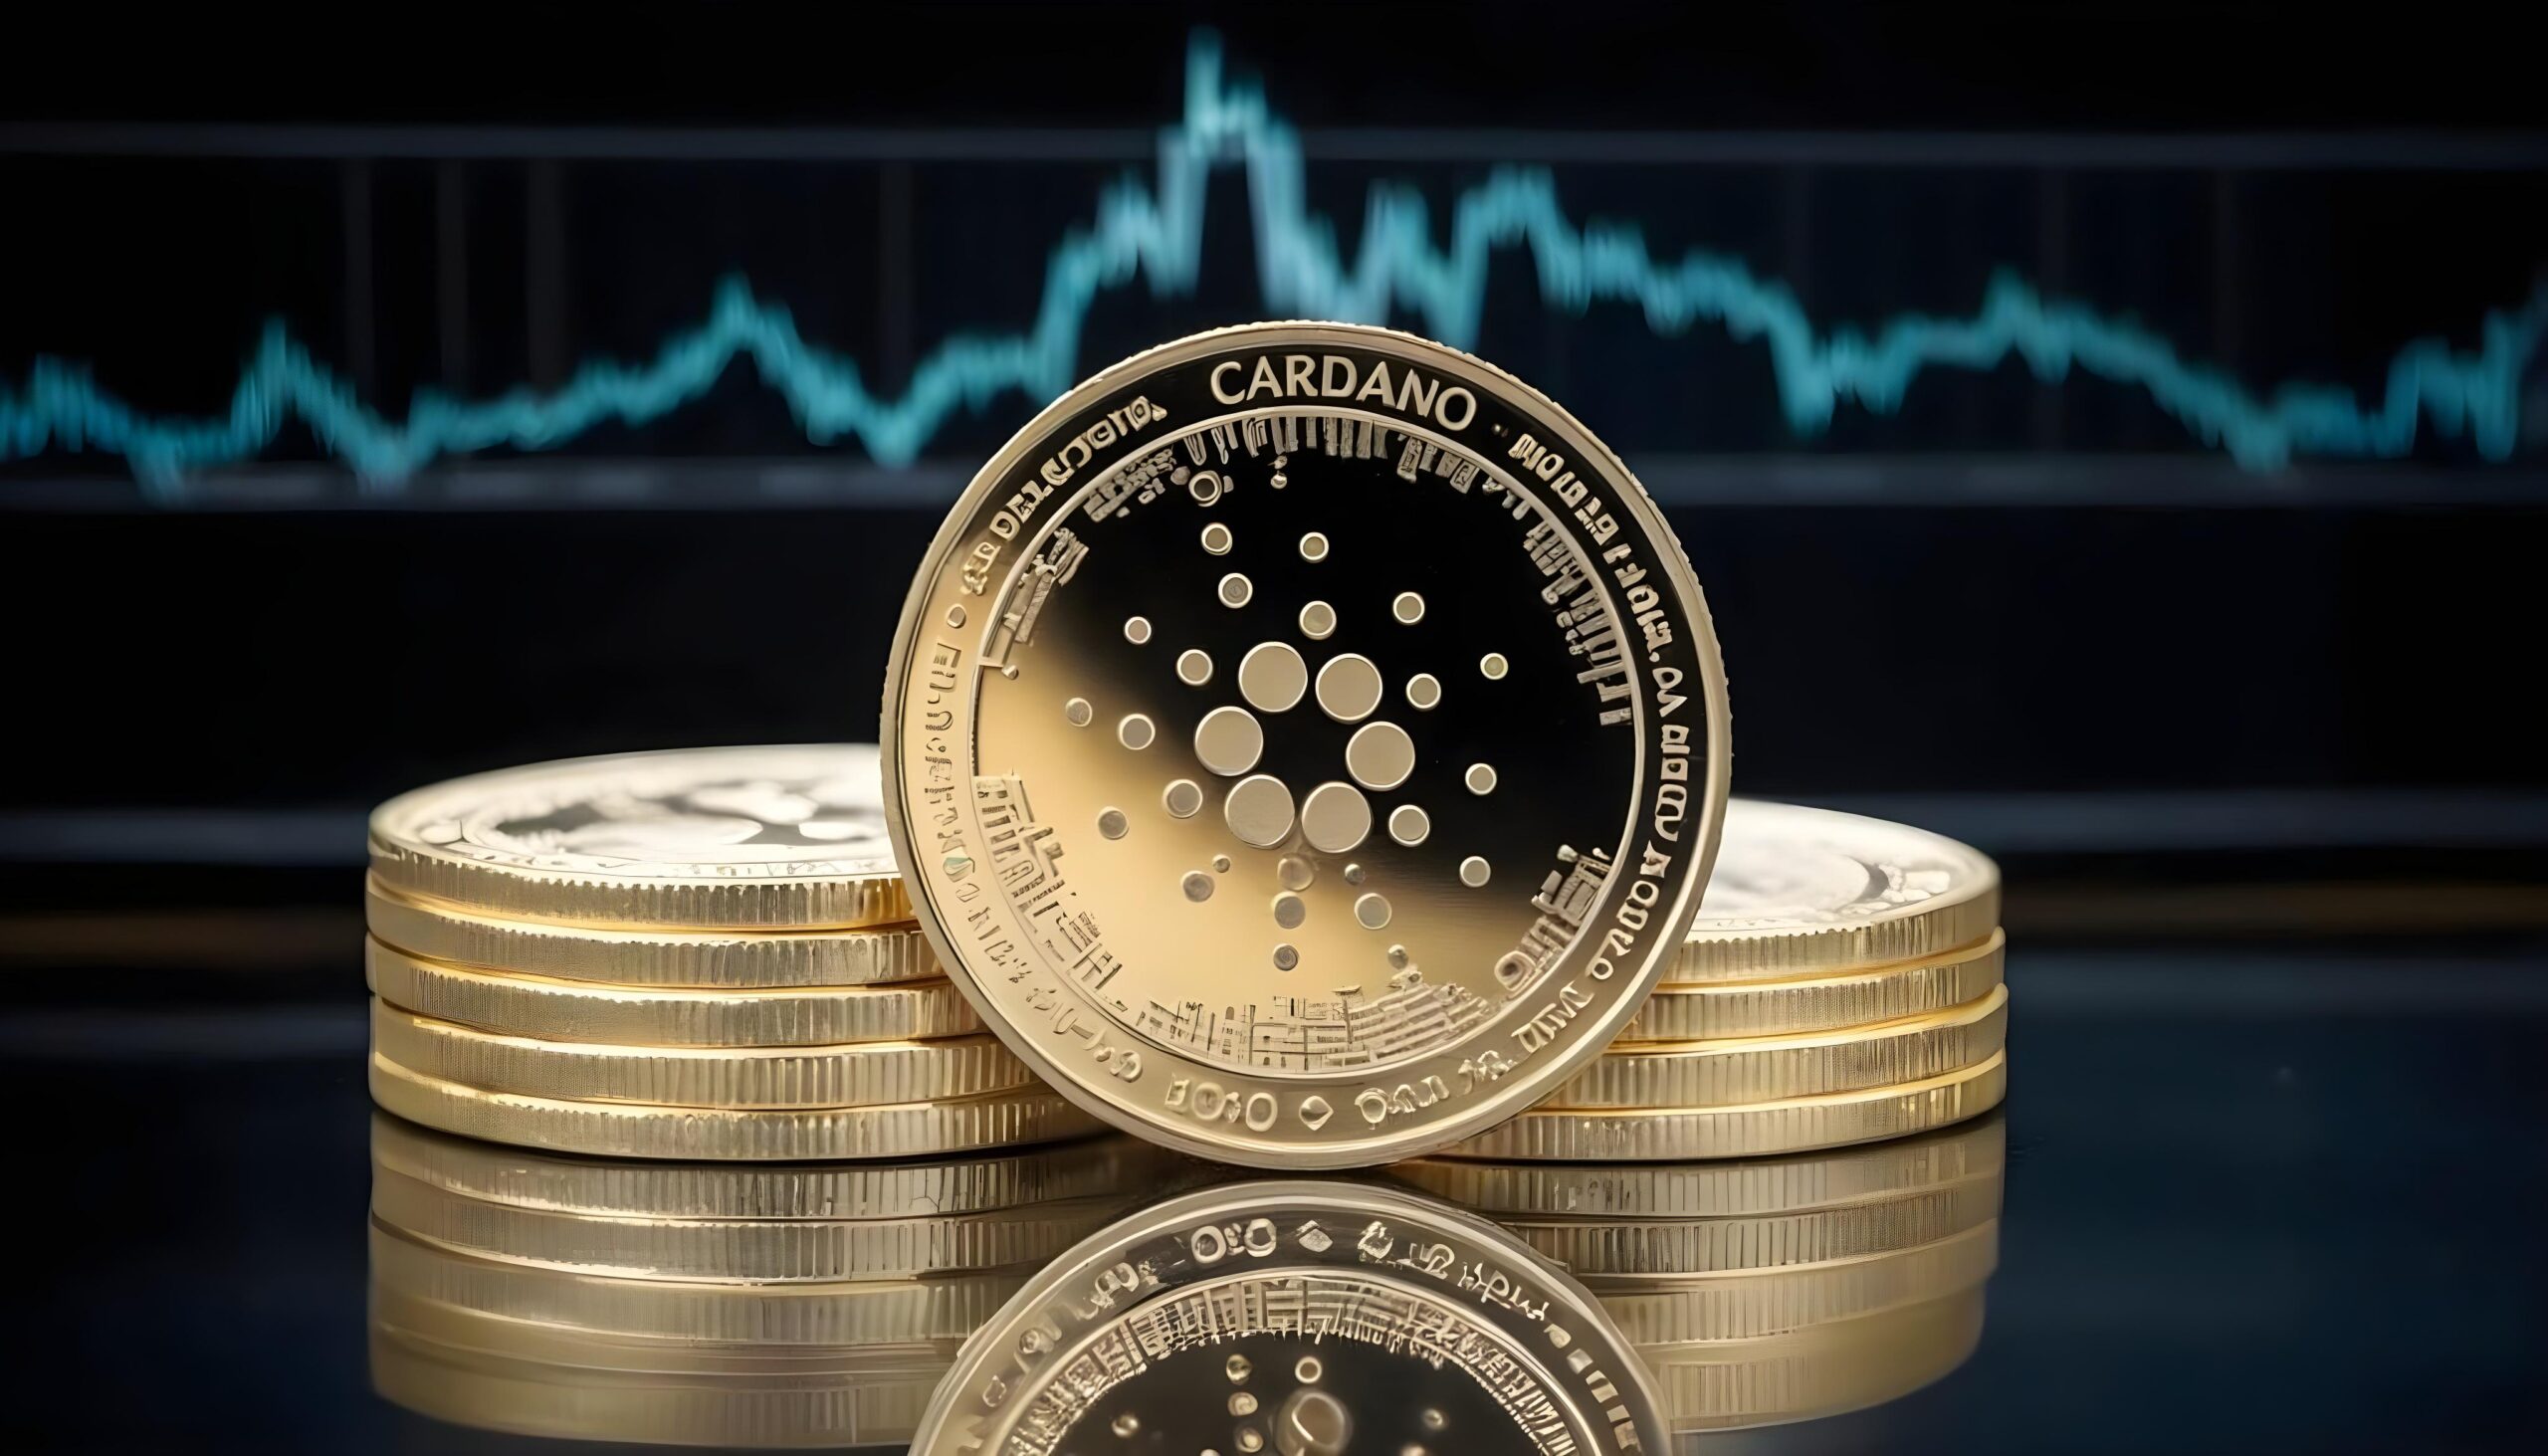
Cardano’s ADA tests critical $0.21–$0.24 support as most altcoins bounce. Elliott Wave analysis warns of a 9-cent target if bulls fail to defend this zone.
Most altcoins have started bouncing. Cardano has not done anything for months.
More Crypto Online, on X, put it plainly: “$ADA is testing 2023 lows while most altcoins have already started a bounce.” The post, shared April 26, flagged support at $0.21 to $0.24 as the level being tested “repeatedly without an impulsive reaction.” No strong green weekly candle. No buyers stepping in with conviction.
Price was sitting near $0.2497 at the time of posting.
When Support Gets Tested This Many Times, It Stops Looking Like Support
The weekly ADA/USD chart on Kraken carries an Elliott Wave and Fibonacci overlay. According to the analysis attached to the More Crypto Online post, the entire move since Cardano’s 2021 all-time high is a large corrective phase. Wave A bottomed around the 2022 to 2023 lows. Wave B carried price back into the mid-2024 and early-2025 area. What comes after that is Wave C.
That is where Cardano sits right now. Deep inside it.
The thick red horizontal band between roughly $0.21 and $0.24 has become the defining line on the chart. It maps exactly to the 2023 lows that More Crypto Online flagged. Every retest without an impulsive response makes the level less reliable. Bulls keep showing up. Just not in size.
“If it breaks, 9 cents becomes a realistic target,” the post stated. “If the bulls want to avoid that, this is one of the last opportunities to step in.”
The Cardano support breakdown story has been building for months across the charts.
The Numbers the Chart Is Actually Showing
Fibonacci levels pulled from the Wave B high put the 38.2% retracement already behind us at around $0.42. The 61.8% level, marked with a dashed red line on the chart, sits near $0.62. Price broke through both on the way down.
The 100% extension of that corrective structure lands at $0.0925. Nine cents. That is the number More Crypto Online said becomes realistic if the $0.21 floor gives way on a weekly close.
Deeper Fibonacci extensions inside the projected target zone go further. The most pessimistic counts on the chart reach $0.0335 and $0.0178. Those are not the base case. They exist in the chart nonetheless.
On the upside, a confirmed reversal from this zone would open a first resistance cluster between $1.33 and two dollars. A full recovery scenario carries targets toward $2.65 and beyond. The chart holds both possibilities simultaneously. Right now one looks more likely than the other.
Five Years Into a Correction
The corrective structure on the weekly chart started in 2021. According to More Crypto Online’s analysis, Cardano is now in year five of this move. That is long even by crypto standards.
The Cardano DeFi deployment announced weeks ago by the Cardano Foundation added eight-figure ADA liquidity into decentralized exchanges. Fundamental action happening at the protocol level. The chart has not responded to it.
That gap between what the network is doing and what price is doing is part of what makes ADA’s current position unusual. Activity on chain. Silence on the weekly candle.
More Crypto Online described the structure directly: “Right now it is not proving anything.”
The weekly close this week will be one of the more consequential candles Cardano has printed in 2026. Hold here with volume and structure still has a path. Break below $0.21 on a weekly close and the chart framework points toward nine cents without much in between.


Leave a Reply
You must be logged in to post a comment.