
Bitcoin trades near $78K as $73.7K support holds, with bulls targeting the $96K mean level in the current trend.
Bitcoin traded near $78,057 as traders watched the $73,700 MVRV pricing band. This level has become a key support area for the current trend.
If Bitcoin holds above it, market analysts are looking toward the $96,000 mean level.
However, a break below $73,700 could weaken the bullish bottom setup and shift focus toward $55,000.
Bitcoin Trend Depends on $73,700 Support
Bitcoin has moved above the minus 0.5 MVRV pricing band. The band currently sits near $73,700. Traders are treating this area as a key pivot for the current market trend.
According to Ali Charts, As long as $73,700 holds as support, the objective is a return to the mean.
The mean level is currently near $96,000. This gives traders a clear upside level to watch.
Bitcoin $BTC has successfully claimed the -0.5 MVRV pricing band, which currently sits at $73,700. This level is the pivot point for the current trend.
As long as $73,700 holds as support, the objective is a return to the mean, currently around $96,000.
Should Bitcoin lose the… https://t.co/arxxFtwNtn pic.twitter.com/bt5dtAHwbT
— Ali Charts (@alicharts) April 25, 2026
However, the same view also placed risk below $73,700. If Bitcoin loses that level, the bullish bottom case would weaken.
In that case, attention could return to the realized price near $55,000.
For now, Bitcoin remains above the MVRV support band. Therefore, the recovery attempt remains active. Still, buyers need stronger price action above nearby resistance.
BTC Price Holds Above Daily Support
Bitcoin was trading around $78,057 on the daily chart. The price also held above the market swing low near $77,321.
This shows that buyers are still defending the lower range. Even so, Bitcoin remains below its main Fibonacci recovery levels.
The current chart uses a range from about $77,321 to $108,505. As a result, the rebound has not yet gained full confirmation.
The nearest resistance sits near $85,804. This level matches the 0.786 Fibonacci retracement on the daily chart. A daily close above it could improve the short-term setup.
After that, traders may watch $89,233 and $91,919. Further resistance appears near $96,593. This area also sits close to the stated $96,000 mean target.
Read Also:
Bitcoin Price Analysis: Santiment Flags FOMO Spike as BTC Nears $80K
Momentum Improves as Traders Watch $96,000
The MACD on the daily chart shows early improvement. The MACD line is above the signal line.
Also, the histogram is positive, which points to better short-term momentum.
However, the signal remains early. Bitcoin still needs to clear resistance before a stronger recovery is confirmed. A move above $85,804 would give buyers more control.
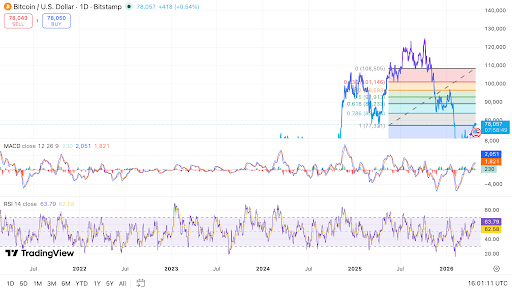
The RSI is near 63 to 64. This level shows stronger buying interest than earlier sessions. It also remains below overbought territory, so price has room to move.
Still, the wider structure remains cautious. Bitcoin is recovering from support, but it has not reclaimed the upper range.
Therefore, traders are watching $73,700, $85,804, and $96,000 closely.
