
Bear market signals stack as Bitcoin’s 30-day demand nears -650K BTC, a reading reached only three times in six years of on-chain history.
The chart goes back to 2019. In that span, one particular threshold has appeared three times. Bitcoin’s 30-day demand growth, measured across spot and perpetual futures combined, has now fallen toward negative 650,000 BTC. CryptoQuant flagged the reading this week.
Spot demand is contracting. Perpetual futures demand is contracting. The two are moving together, which is the part that changes the reading. Weakness in derivatives alone could reflect a leverage flush. This is not that.
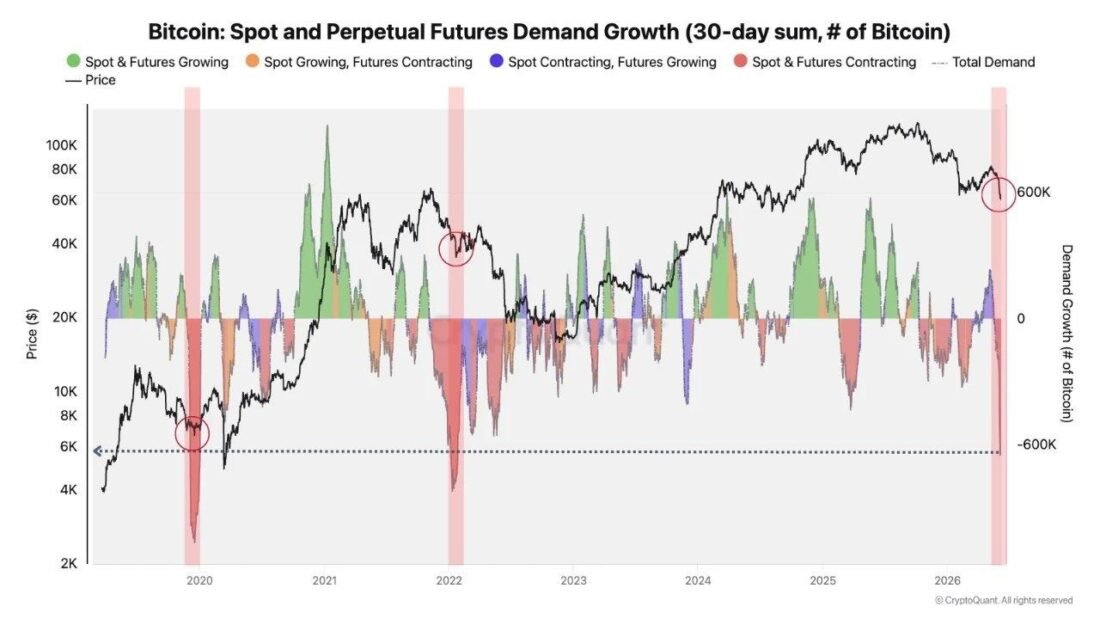
Source: CryptoQuant Bitcoin: Spot and Perpetual Futures Demand Growth (30-day sum)
The Number That Showed Up Before Both the COVID Crash and 2022
The first time demand hit this depth was before March 2020. Not during the crash. Before it. The deterioration had been building for weeks before liquidity finally broke. CryptoQuant’s data shows the metric recovering toward a higher support zone during the March capitulation itself, which is roughly when the COVID bottom actually formed.
Fewer marginal buyers means the market absorbs fresh supply more poorly, that is to say with less cushion, less ability to hold a level when sellers arrive in size. The current chart is showing that compression in real time.
Spot Bitcoin ETFs have now recorded significant outflows through May and early June 2026. Institutional demand through that channel, which had provided some floor in earlier months, stepped back as the on-chain reading deteriorated. The two are not the same metric. They are pointing the same direction.
2022 Saw This Too. It Did Not End Fast.
A similar reading appeared during the 2022 bear market cycle. Extreme demand contraction showed up early. The structural deterioration it reflected took the better part of a year to work through before demand rebuilt with any real conviction. The signal came first. The bottom came much later.

Source: CryptoQuant Bitcoin: Spot and Perpetual Futures Demand Growth, cycle comparison
The recovery toward the higher support zone is where bottoms actually tend to form, not at this depth.
Per CryptoQuant, the probable path from here is initial volatility expansion followed by a stretch of what the firm described as price anesthesia. Weak momentum. Compressed activity. Extended sideways. That phase, the analysis noted, may be harder to sit through psychologically than the sell-off itself was.
On-Chain Stress Was Already Stacking Before This Reading
Bitcoin investors absorbed $1.9 billion in realized losses during the June pullback toward $63.6K. That reading came from CryptoQuant’s Net Realized PnL metric. It did not arrive in isolation.
The demand contraction chart has three circled instances across six years. The current one sits at the far right edge. CryptoQuant did not describe the setup as a confirmed reversal. The framing was more cautious than that.
How long demand stays at this depth before any recovery toward the higher support zone materializes is not answered by the chart. It only shows that this has happened before. Twice, to be precise.


Leave a Reply
You must be logged in to post a comment.