- Bitcoin cash price started a fresh increase from the $280 support against the US Dollar.
- The price is now trading above the $350 zone and the 55 simple moving average (4-hours).
- There is a key bullish trend line forming with support near $360 on the 4-hours chart of the BCH/USD pair (data feed from Coinbase).
- The pair could correct lower, but the bulls might remain active near the $330 support zone.
Bitcoin cash price is showing positive signs above $350 against the US Dollar, similar to bitcoin. BCH/USD must stay above $330 to start a fresh increase.
Bitcoin Cash Price Analysis
Bitcoin cash price formed a base above the $280 level and started a fresh increase. BCH was able to clear the $300 resistance zone to move into a positive zone.
There was a clear move above the $330 resistance and the 55 simple moving average (4-hours). The price even surged above the $350 level. A high is formed near $387 and the price is now correcting lower. There was a drop below the $380 and $375 support levels.
The price traded below the 23.6% Fib retracement level of the upward move from the $277 swing low to $387 high. It is now consolidating near the $360 support.
There is also a key bullish trend line forming with support near $360 on the 4-hours chart of the BCH/USD pair. The next major support is near the $350 level, below which the bears gain strength. The next target for them may perhaps be near the $330 level.
The 50% Fib retracement level of the upward move from the $277 swing low to $387 high is also near the $330 level. On the upside, the price is now facing resistance near the $370 level.
The next major resistance is near the $385 level. A clear break above $380 and $385 might start a fresh increase. In the stated case, the price could rise towards the $400 resistance zone. The next major hurdle is near the $440 level.
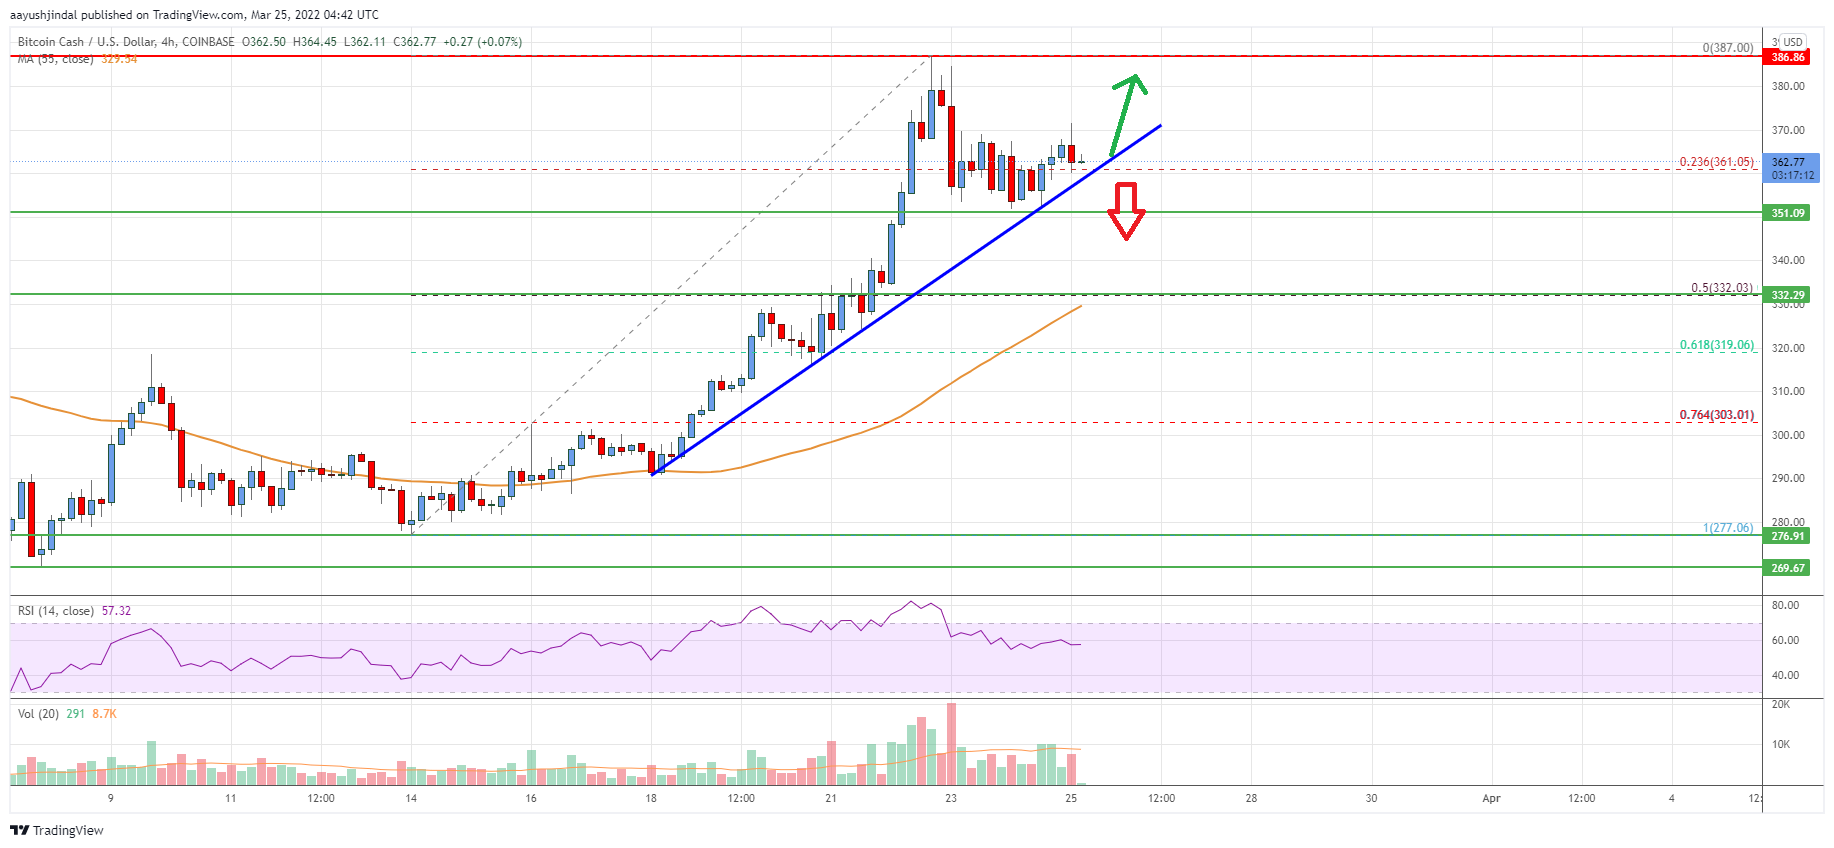
Looking at the chart, bitcoin cash price is now trading above the $350 zone and the 55 simple moving average (4-hours). Overall, the price could correct lower, but the bulls might remain active near the $330 support zone.
Technical indicators
4 hours MACD – The MACD for BCH/USD is slowly losing pace in the bullish zone.
4 hours RSI (Relative Strength Index) – The RSI for BCH/USD is now above the 50 level.
Key Support Levels – $360 and $330.
Key Resistance Levels – $370 and $385.