
- Bitcoin cash price started a fresh decline from the $320 resistance against the US Dollar.
- The price is now trading near the $300 zone and the 55 simple moving average (4-hours).
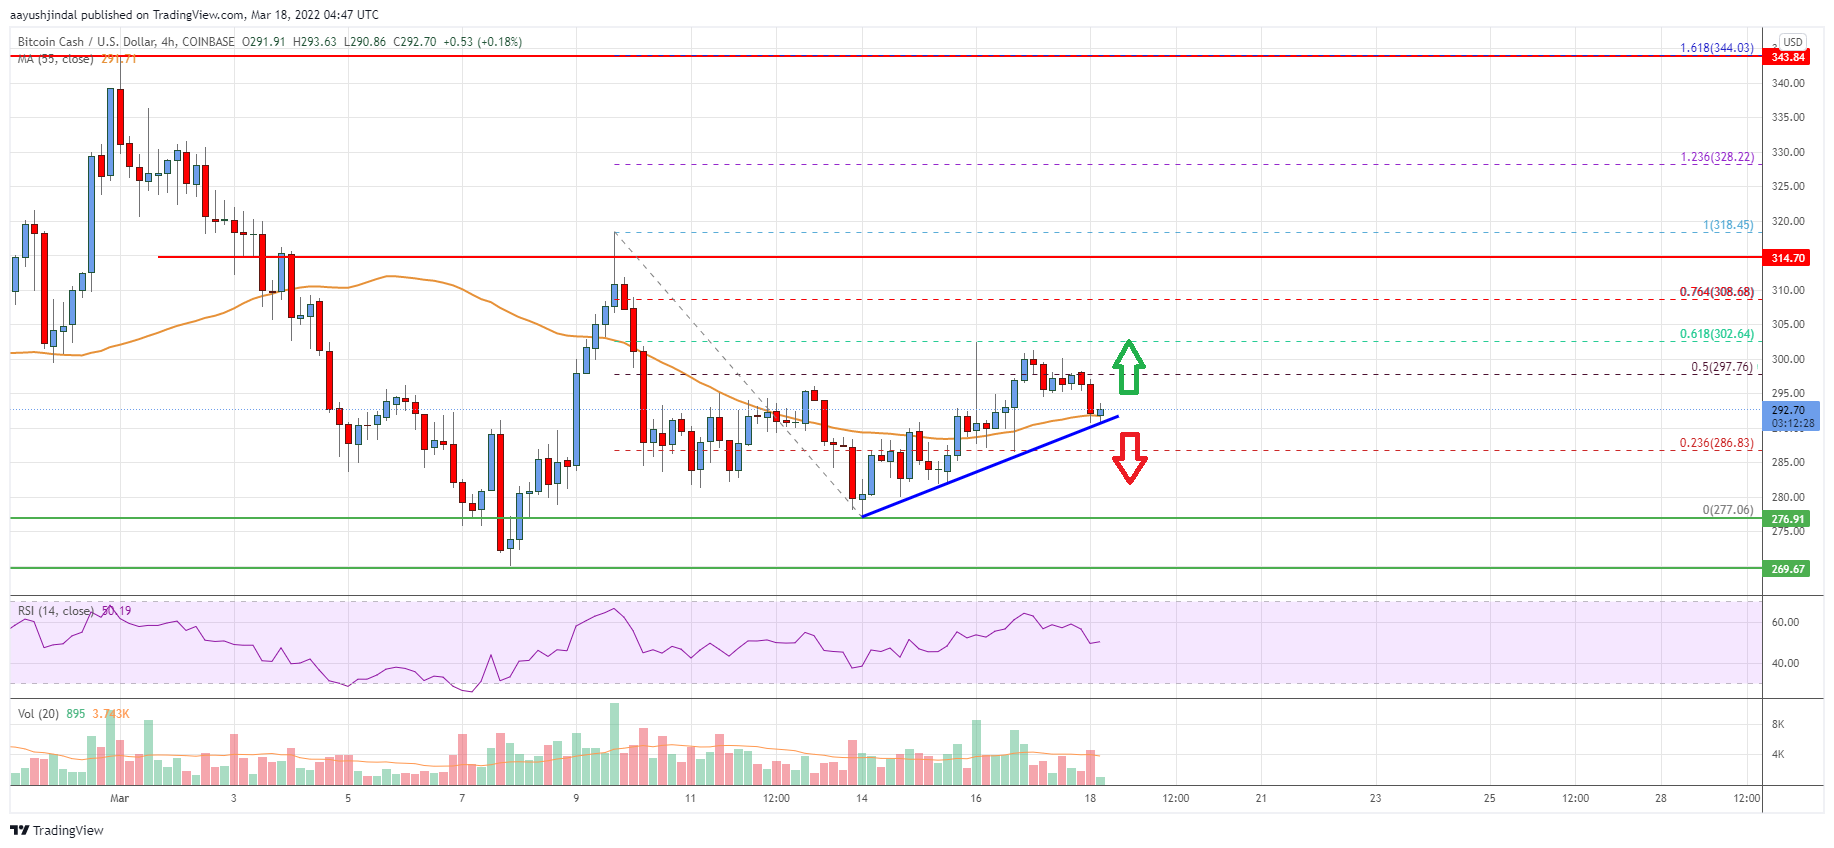
- There is a key bullish trend line forming with support near $290 on the 4-hours chart of the BCH/USD pair (data feed from Coinbase).
- The pair could continue to move down if there is a break below the $290 support in the near term.
Bitcoin cash price is struggling below $320 against the US Dollar, similar to bitcoin. BCH/USD must stay above $290 to avoid more downsides in the near term.
Bitcoin Cash Price Analysis
Bitcoin cash price attempted an upside break above the $319 and $320 resistance levels. However, BCH struggled near the $320 zone and declined sharply.
There was a clear move below the $300 level and the 55 simple moving average (4-hours). The price traded as low as $277 and recently started a fresh increase. There was a move above the $280 and $285 resistance levels. It even climbed above the 50% Fib retracement level of the recent decline from the $318 swing high to $277 low.
However, the bears are active near the $300 zone. The price also failed to gain pace above the 61.8% Fib retracement level of the recent decline from the $318 swing high to $277 low.
The next major resistance is near the $305 level. A clear break above $300 and $305 might start a fresh increase. In the stated case, the price could rise towards the $320 resistance zone. The next major hurdle is near the $340 level.
If there is no upside break, the price might decline below the $290 support. There is also a key bullish trend line forming with support near $290 on the 4-hours chart of the BCH/USD pair.
The next major support is near the $275 level, below which the bears gain strength. The next target for them may perhaps be near the $250 level.
On the upside, the price is now facing resistance near the $300 resistance and the 55 simple moving average (4-hours). The next major resistance is near the $320 level.
Looking at the chart, bitcoin cash price is now trading near the $300 zone and the 55 simple moving average (4-hours). Overall, the price could continue to move down if there is a break below the $290 support in the near term.
Technical indicators
4 hours MACD – The MACD for BCH/USD is slowly gaining pace in the bearish zone.
4 hours RSI (Relative Strength Index) – The RSI for BCH/USD is now near the 50 level.
Key Support Levels – $290 and $275.
Key Resistance Levels – $300 and $320.


Leave a Reply
You must be logged in to post a comment.