
- Bitcoin cash price started a solid upward move above the $300 resistance against the US Dollar.
- The price is currently trading below the $325 and $330 resistance levels.
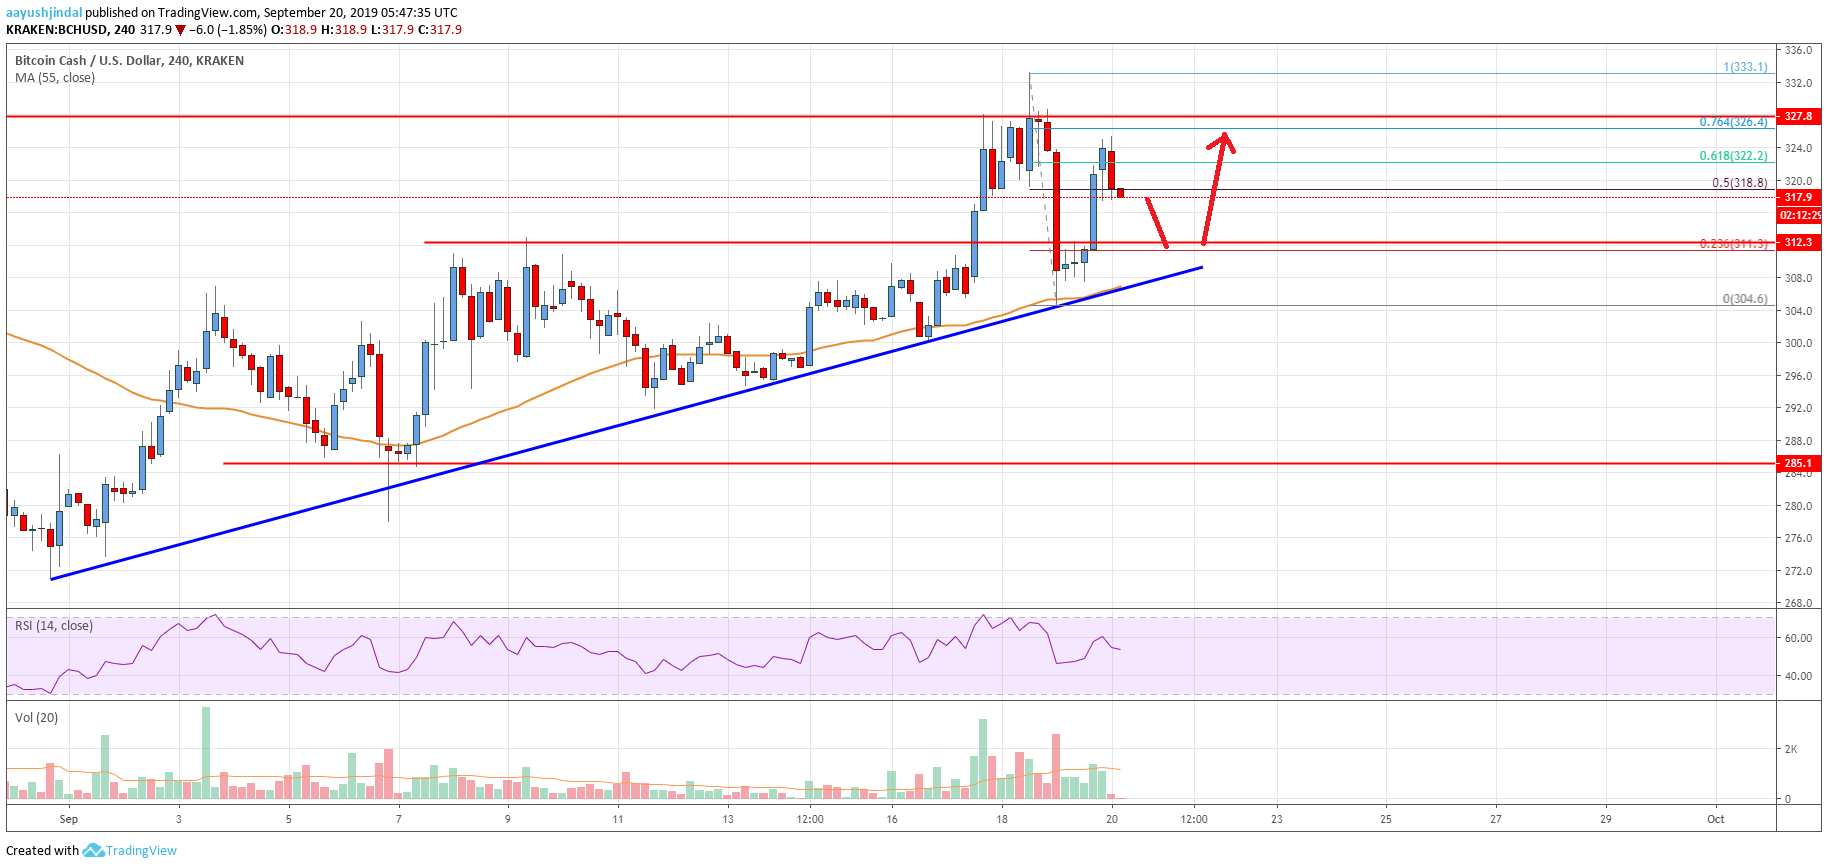
- There is a major bullish trend line forming with support near $308 on the 4-hours chart of the BCH/USD pair (data feed from Kraken).
- The pair could continue to rise as long as it is above the $300 support area.
Bitcoin cash price is gaining momentum above $310 against the US Dollar. If BCH/USD clears the $330 resistance it could even climb above the $340 resistance area.
Bitcoin Cash Price Analysis
After forming a base near the $285 level, bitcoin cash price started a nice upward move against the US Dollar. The BCH/USD pair climbed above the key $300 resistance level to move into a positive zone. Moreover, there was a close above the $300 level and the 55 simple moving average (4-hours). Finally, the price traded above the $310 and $320 levels. a new monthly high was formed near $333 and the price is currently correcting gains.
It declined sharply below the $310 level. However, the price found support near $305 and the 55 simple moving average (4-hours). A swing low was formed near $304 and the price recovered above $310. There was a break above the $315 level, plus the 50% Fib retracement level of the recent decline from the $333 high to $304 low. The price even traded above the $320 level.
At the moment, the price is struggling to stay above the 61.8% Fib retracement level of the recent decline from the $333 high to $304 low. As a result, there is a chance of a fresh dip towards the $312 and $310 support levels. Moreover, there is a major bullish trend line forming with support near $308 on the 4-hours chart of the BCH/USD pair.
If there is a downside correction, the price is likely to find bids near the $310 and $308 levels. Only a close below the $300 pivot level could start a fresh decrease. On the upside, an initial resistance is near the $325 level. However, the price must gain momentum above the $340 level to accelerate gains in the coming days.
Looking at the chart, bitcoin cash price is clearly trading in an uptrend above the $310 support area. As long as there is no break below $300, the price is likely to continue higher towards $340 and $350.
Technical indicators
4 hours MACD – The MACD for BCH/USD is gaining momentum in the bullish zone.
4 hours RSI (Relative Strength Index) – The RSI for BCH/USD is still well above the 50 level.
Key Support Levels – $310 and $300.
Key Resistance Levels – $325 and $340.


Leave a Reply
You must be logged in to post a comment.