- Bitcoin cash price is currently recovering and trading above the $300 level against the US Dollar.
- The price is facing a few key resistances near the $320 and $325 levels.
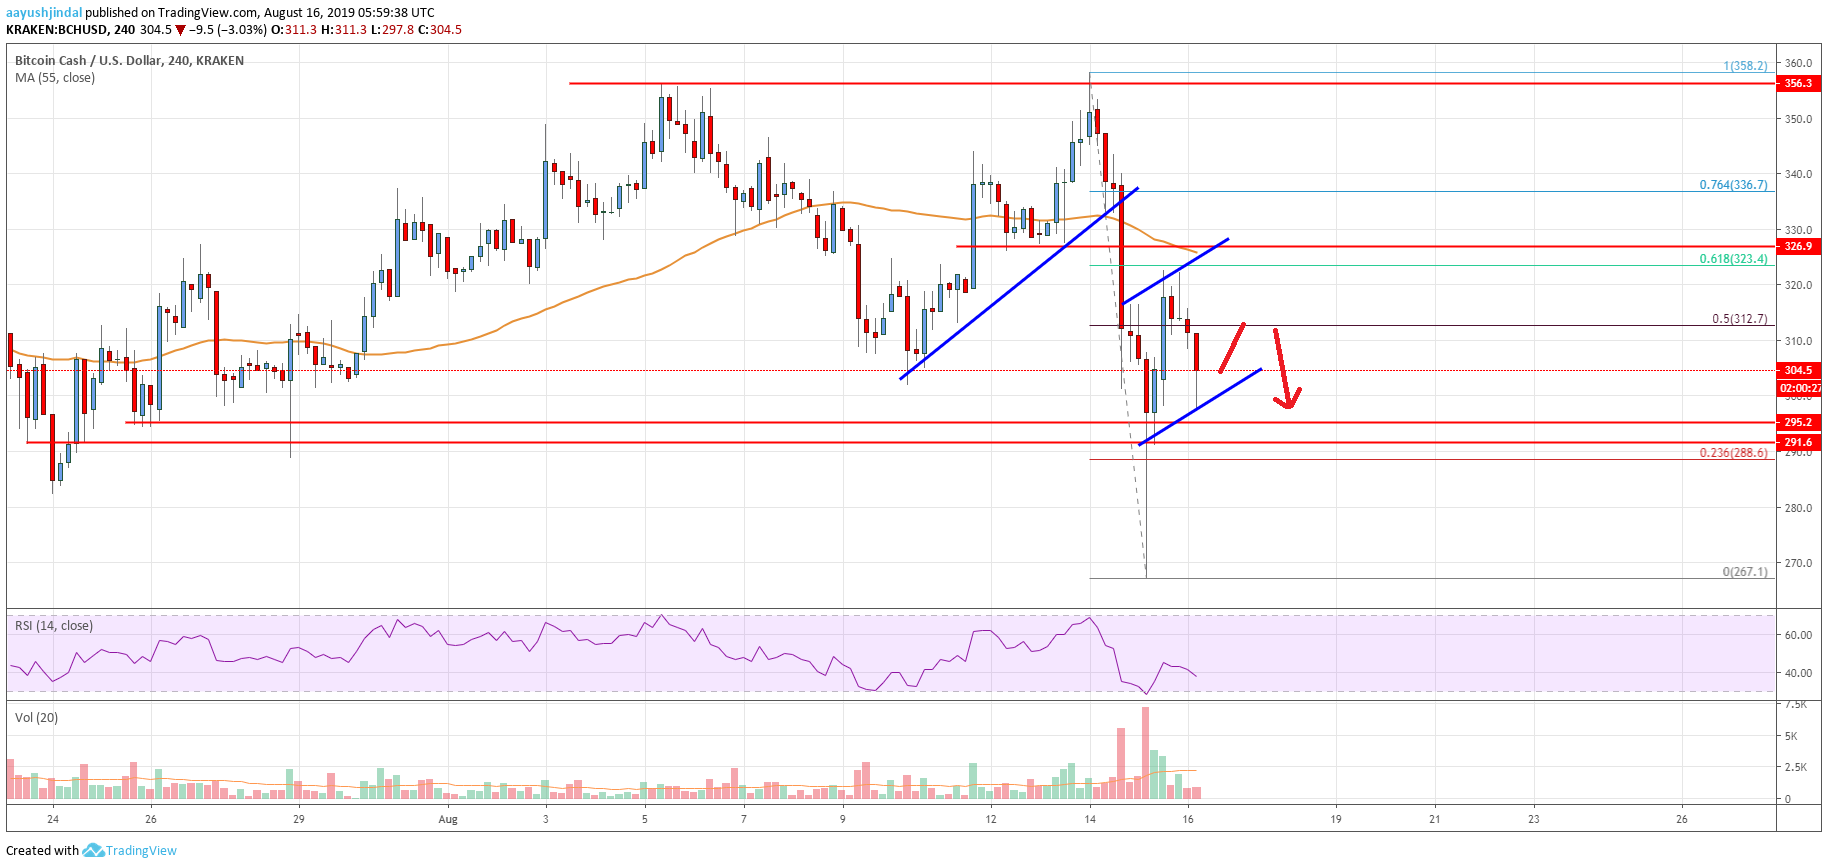
- Earlier, there was a break below a major bullish trend line with support near $336 on the 4-hours chart of the BCH/USD pair (data feed from Kraken).
- The pair could accelerate losses if there is a downside break below the $290 support area.
Bitcoin cash price is holding an important support near $290 against the US Dollar. BCH price could either climb above $325 or it might resume its decline below $290.
Bitcoin Cash Price Analysis
Earlier this week, bitcoin cash price surged above the $340 and $350 resistance levels against the US Dollar. The BCH/USD pair traded close to the $360 level, but it struggled to continue higher. A swing high was formed near the $358 level and recently the price started a strong decline. It broke the $350 and $340 support levels to move back into a bearish zone.
Moreover, there was a break below a major bullish trend line with support near $336 on the 4-hours chart of the BCH/USD pair. The pair even traded below the $300 support and settled below the 55 simple moving average (4-hours). Finally, the price found support near the $270 level and recovered above $280 and $290. Additionally, the price traded above the 50% Fib retracement level of the downward move from the $258 high to $267 low.
However, the upward move was capped near the $320 level. It seems like the 61.8% Fib retracement level of the downward move from the $258 high to $267 low acted as a resistance. At the moment, the price is trading inside an ascending channel with support near the $300 level. The main support is near the $290 level, below which the price could accelerate losses in the near term. In the mentioned case, it could revisit $270.
On the upside, there are a few key resistances near the $320 and $325 levels. A convincing break above the $325 level is needed for a decent upward move. Above $325, the price could climb above the $340 and $345 levels in the near term.
Looking at the chart, bitcoin cash price is showing a few negative signs below the $320 and $325 resistance. However, a clear bearish break below the $290 support is needed for a downside acceleration.
Technical indicators
4 hours MACD – The MACD for BCH/USD is gaining momentum in the bearish zone.
4 hours RSI (Relative Strength Index) – The RSI for BCH/USD is currently below 50, with a bearish angle.
Key Support Levels – $300 and $290.
Key Resistance Levels – $320 and $325.
