- Bitcoin cash price declined heavily and it even tested the $470 level against the US Dollar.
- The price is now trading just above $700 and the 55 simple moving average (4-hours).
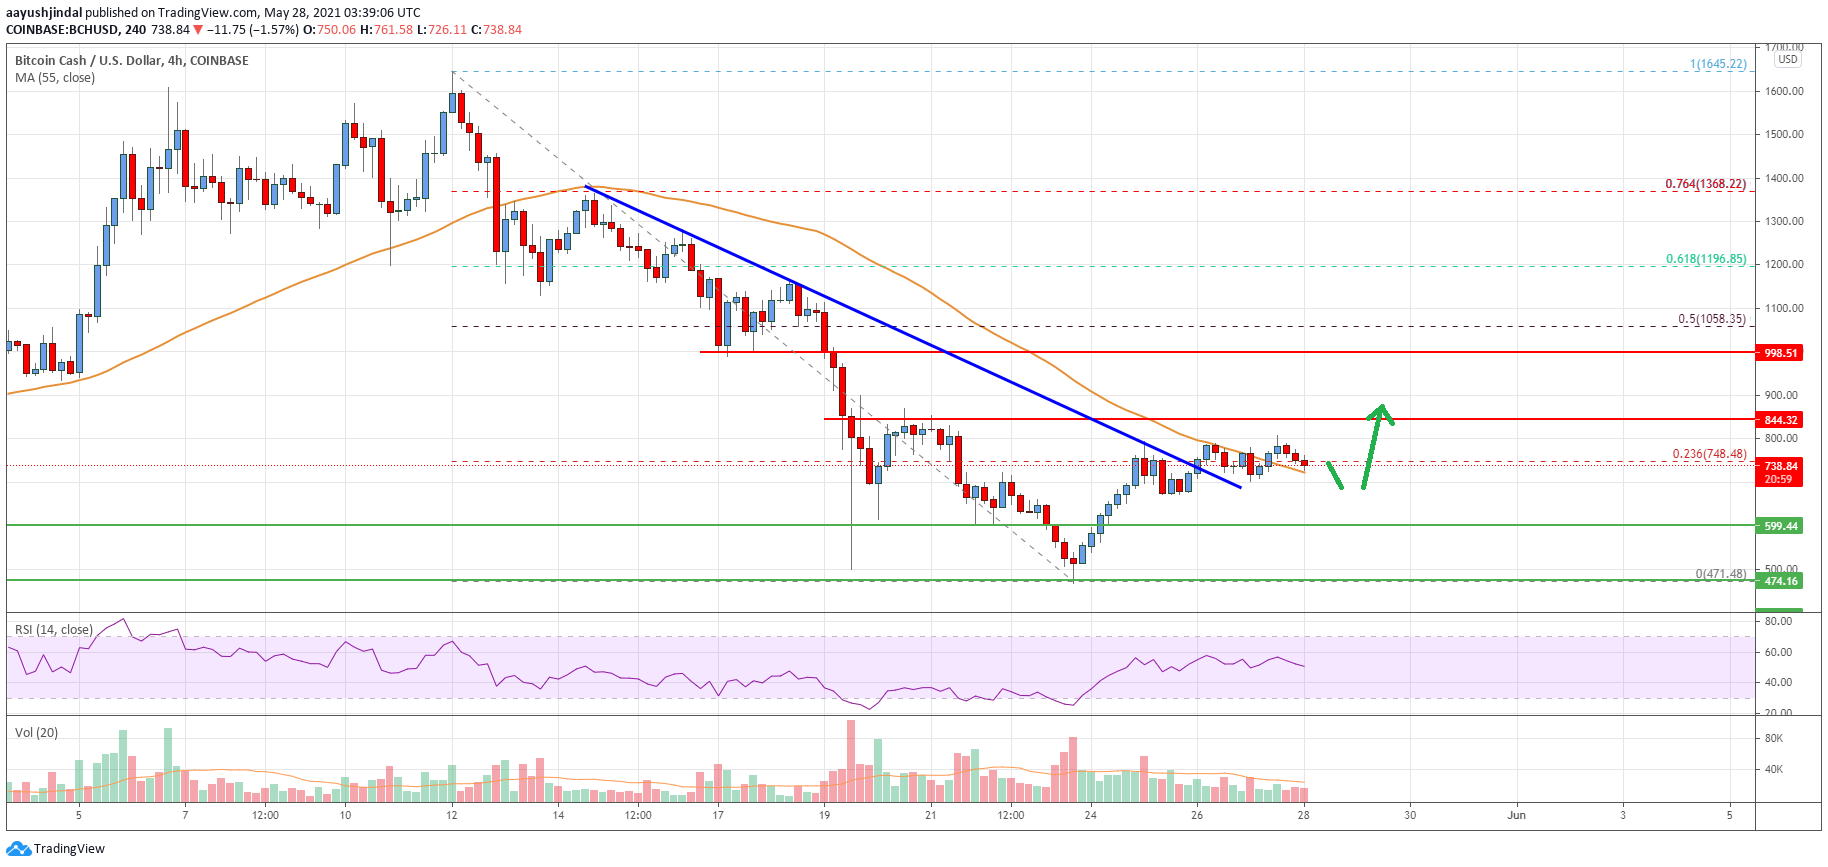
- There was a break above a major bearish trend line with resistance near $750 on the 4-hours chart of the BCH/USD pair (data feed from Coinbase).
- The pair is consolidating and it might attempt an upside break above $800 and $850.
Bitcoin cash price is recovering losses from $500 against the US Dollar, similar to bitcoin. BCH/USD must surpass $850 to move back into a positive zone.
Bitcoin Cash Price Analysis
After a sharp decline, bitcoin cash price settled below the $1,000 level. BCH broke many important supports near $850 to move further into a bearish zone.
The price even broke the $650 support level and settled below the 55 simple moving average (4-hours). Finally, the price spiked below $500 and traded as low as $471. Recently, there was an upside correction above the $600 and $650 levels.
There was a break above a major bearish trend line with resistance near $750 on the 4-hours chart of the BCH/USD pair. The pair climbed above the 23.6% Fib retracement level of the key decline from the $1,645 high to $471 low.
The price is now trading just above $700 and the 55 simple moving average (4-hours). An immediate resistance on the upside is near the $800 level. The first major resistance is near the $850 level. A clear upside break above the $850 level could lead the price towards $1,000.
The 50% Fib retracement level of the key decline from the $1,645 high to $471 low is also near the $1,050 level. Conversely, the price could start a fresh decline below the $650 support.
The next major support is near the $600 level. Any more losses could lead the price towards the main $500 support zone.

Looking at the chart, bitcoin cash price is clearly trading just above $700 and the 55 simple moving average (4-hours). Overall, the price is consolidating and it might attempt an upside break above $800 and $850 in the near term.
Technical indicators
4 hours MACD – The MACD for BCH/USD is now losing pace in the bullish zone.
4 hours RSI (Relative Strength Index) – The RSI for BCH/USD is close to the 50 level.
Key Support Levels – $650 and $600.
Key Resistance Levels – $850 and $1,000.


Leave a Reply
You must be logged in to post a comment.