- Bitcoin price started a steady recovery from the $31,120 zone against the US Dollar.
- The price is now testing the $40,000 resistance zone and the 55 simple moving average (4-hours).
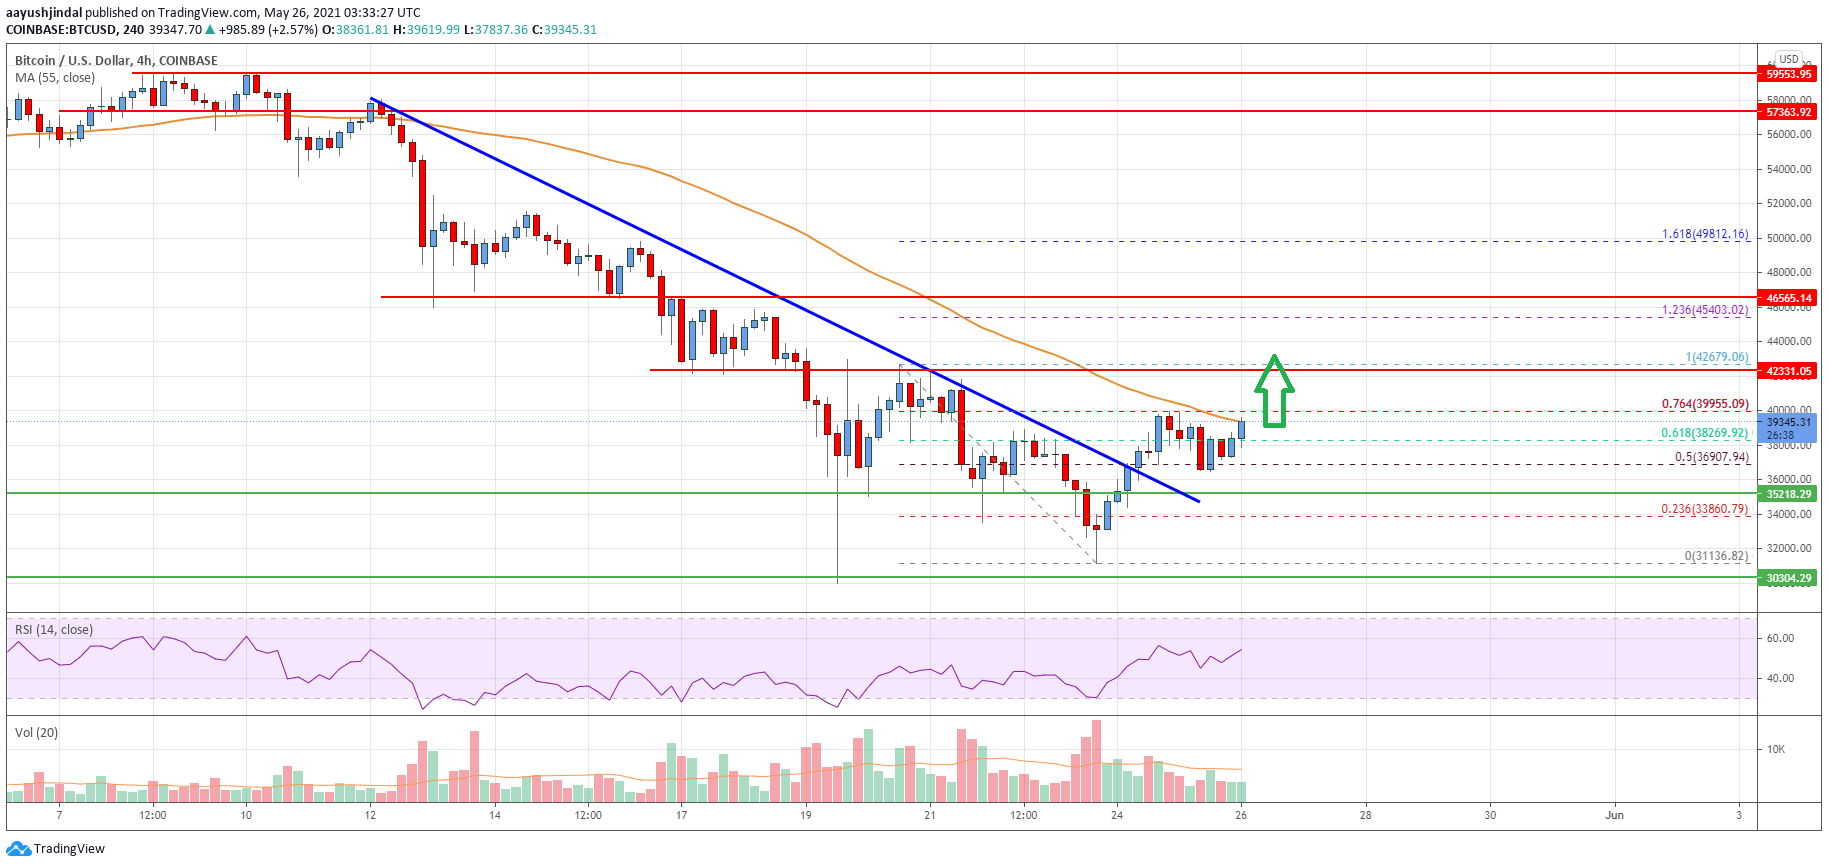
- There was a break above a major bearish trend line with resistance near $36,900 on the 4-hours chart of the BTC/USD pair (data feed from Coinbase).
- The pair is likely to clear the $40,000 resistance and continue higher in the near term.
Bitcoin price is attempting an upside break above $40,000 against the US Dollar. BTC must surpass $40,000 and $42,000 to start a strong upward move.
Bitcoin Price Analysis
Bitcoin price formed a base above the $31,000 and $31,500 levels. As a result, there was a steady recovery initiated above the $35,000 resistance zone.
The price climbed above the $36,500 resistance zone. There was a clear break above the 50% Fib retracement level of the recent decline from the $42,679 swing high to $31,136 low. There was also a break above a major bearish trend line with resistance near $36,900 on the 4-hours chart of the BTC/USD pair.
The pair is now testing the $40,000 resistance zone and the 55 simple moving average (4-hours). It is facing resistance near the 76.4% Fib retracement level of the recent decline from the $42,679 swing high to $31,136 low.
If there is an upside break above the $40,000 resistance and the 55 simple moving average (4-hours), the price could rise towards the $42,000 resistance zone. Any more gains could open the doors for a steady increase towards the $45,000 resistance zone in the near term.
On the downside, the $38,000 level is a decent support. The first major support is now forming near the $35,200 level. If there is a downside break below the $35,200 support, the price could resume its decline. In the stated case, the price is likely to test the $31,000 and $30,000 support levels in the near term.

Looking at the chart, bitcoin price is clearly t trading well below $45,000 and the 55 simple moving average (4-hours). Overall, the price is likely to start a strong recovery if it settles above $42,000 in the near term.
Technical indicators
4 hours MACD – The MACD is slowly gaining momentum in the bullish zone.
4 hours RSI (Relative Strength Index) – The RSI is now above the 50 level.
Key Support Levels – $38,000 and $35,200.
Key Resistance Levels – $40,000, $42,000 and $45,000.


Leave a Reply
You must be logged in to post a comment.