
- Bitcoin cash price started a fresh increase above the $600 zone against the US Dollar.
- The price is now trading above the $650 zone and the 55 simple moving average (4-hours).
- There is a key contracting triangle forming with resistance near $710 the 4-hours chart of the BCH/USD pair (data feed from Coinbase).
- The pair must gain pace above $710 for a sustained move higher towards $650.
Bitcoin cash price is showing positive signs above $650 against the US Dollar, similar to bitcoin. BCH/USD could resume its increase as long as it is above $650.
Bitcoin Cash Price Analysis
Bitcoin cash price gained pace after there was a close above $600. As a result, BCH climbed above the $650 resistance and the 55 simple moving average (4-hours).
The upward move extended above the $700 level. The price traded as high as $731 before it started a downside correction. There was a break below the $700 and $690 support levels. The price traded below the 23.6% Fib retracement level of the upward move from the $577 swing low to $731 high.
It is now trading above the $650 zone and the 55 simple moving average (4-hours). An initial support is near the $665 level. The first major support is near the $660 level. It is near the 50% Fib retracement level of the upward move from the $577 swing low to $731 high.
A downside break below the $660 and $655 support levels might start a major decline. The next major support is near the $620 level, below which the bears might aim a test of $600. Any more downsides might lead the price towards the $550 level.
An immediate hurdle on the upside is near the $700 level. There is also a key contracting triangle forming with resistance near $710 the 4-hours chart of the BCH/USD pair. A clear break above $700 and $710 might spark a fresh rally. In the stated case, the price could rise towards the $750 level. An intermediate resistance might be near the $735 level.
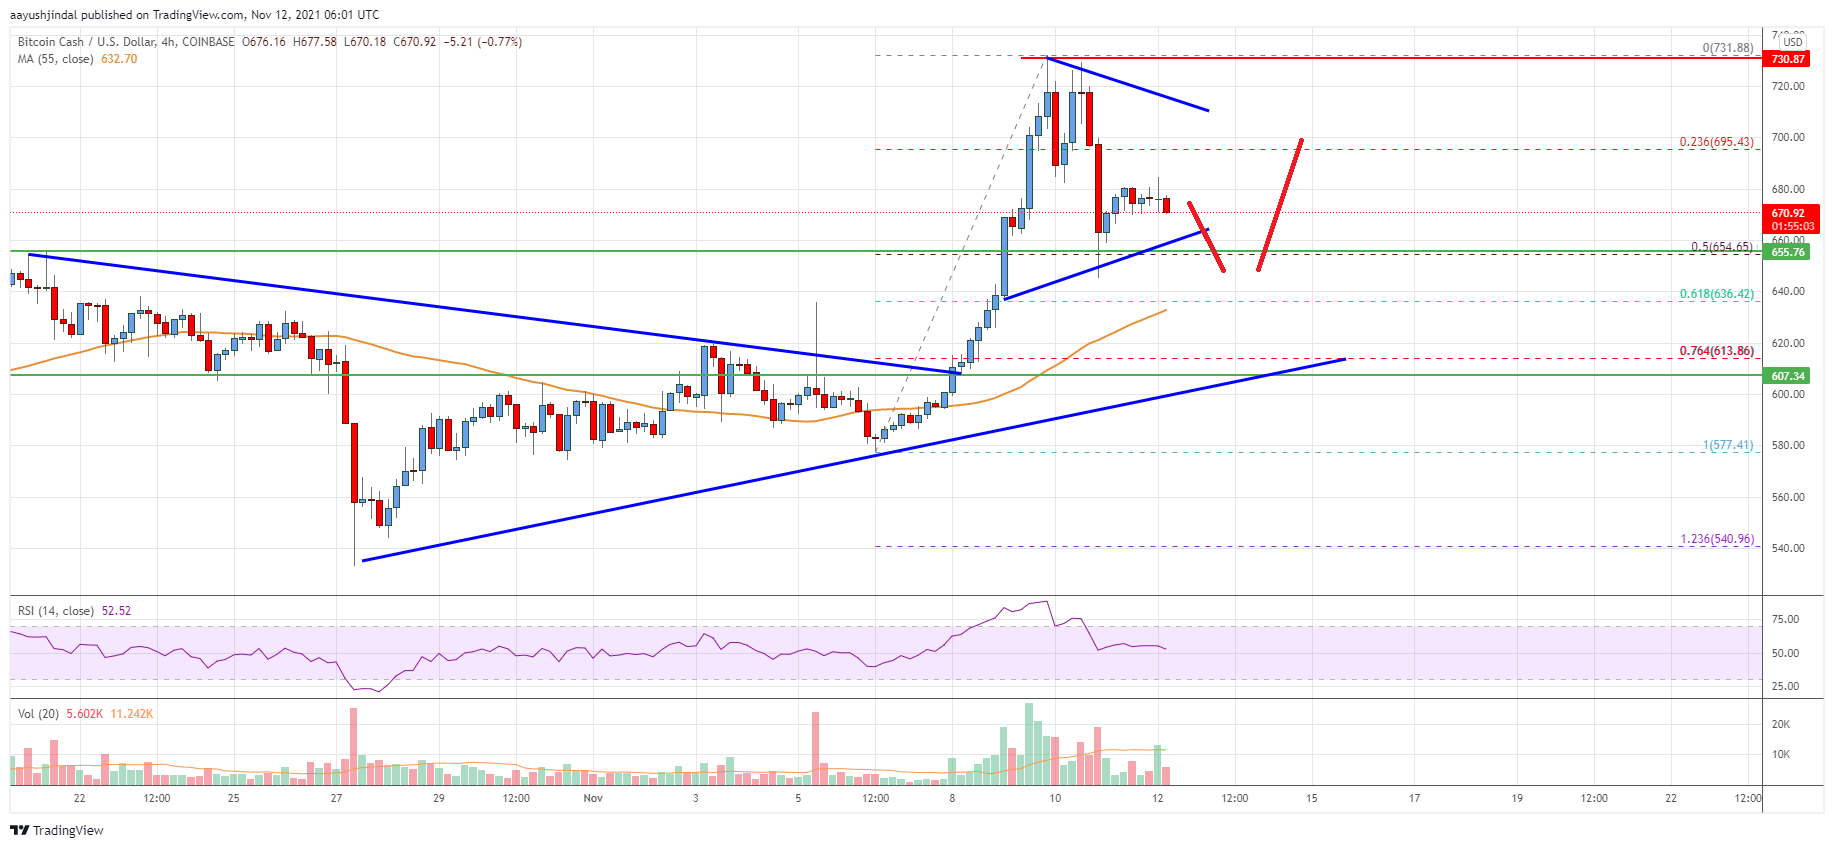
Looking at the chart, bitcoin cash price is now trading above the $650 zone and the 55 simple moving average (4-hours). Overall, the price must gain pace above $710 for a sustained move higher towards $650.
Technical indicators
4 hours MACD – The MACD for BCH/USD is slowly gaining pace in the bearish zone.
4 hours RSI (Relative Strength Index) – The RSI for BCH/USD is now above the 50 level.
Key Support Levels – $660 and $650.
Key Resistance Levels – $700 and $750.


Leave a Reply
You must be logged in to post a comment.