- Bitcoin cash price is struggling to clear the $560 resistance zone against the US Dollar.
- The price is now trading well above $520 and the 55 simple moving average (4-hours).
- There is a key bullish trend line forming with support near $535 on the 4-hours chart of the BCH/USD pair (data feed from Coinbase).
- The pair is likely to start a strong surge if there is a break above $560 and $570.
Bitcoin cash price is likely preparing for a fresh increase above $570 against the US Dollar, while bitcoin is rising. BCH/USD could surge to $650 if it clears $570.
Bitcoin Cash Price Analysis
After testing the $450 support zone, bitcoin cash price started a fresh increase. BCH price broke the $500 resistance to move into a positive zone.
The price even climbed above the $520 resistance and settled above the 55 simple moving average (4-hours). However, the price is now struggling to clear the $560 and $570 resistance levels. The recent high was formed near $570 before the price dipped a few points.
It corrected below the $550 level. There was a break below the 23.6% Fib retracement level of the upward move from the $473 swing low $570 high. On the downside, the $530 level is a strong support.
There is also a key bullish trend line forming with support near $535 on the 4-hours chart of the BCH/USD pair. If there is a downside break below the trend line support, the pair could decline towards the $520 support. It is close to the 50% Fib retracement level of the upward move from the $473 swing low $570 high.
Any more losses might call for a drop towards the $500 level. On the upside, the price is facing many hurdles near the $560 and $570 levels. A clear close above $570 might start a strong surge towards $620 or even $650.
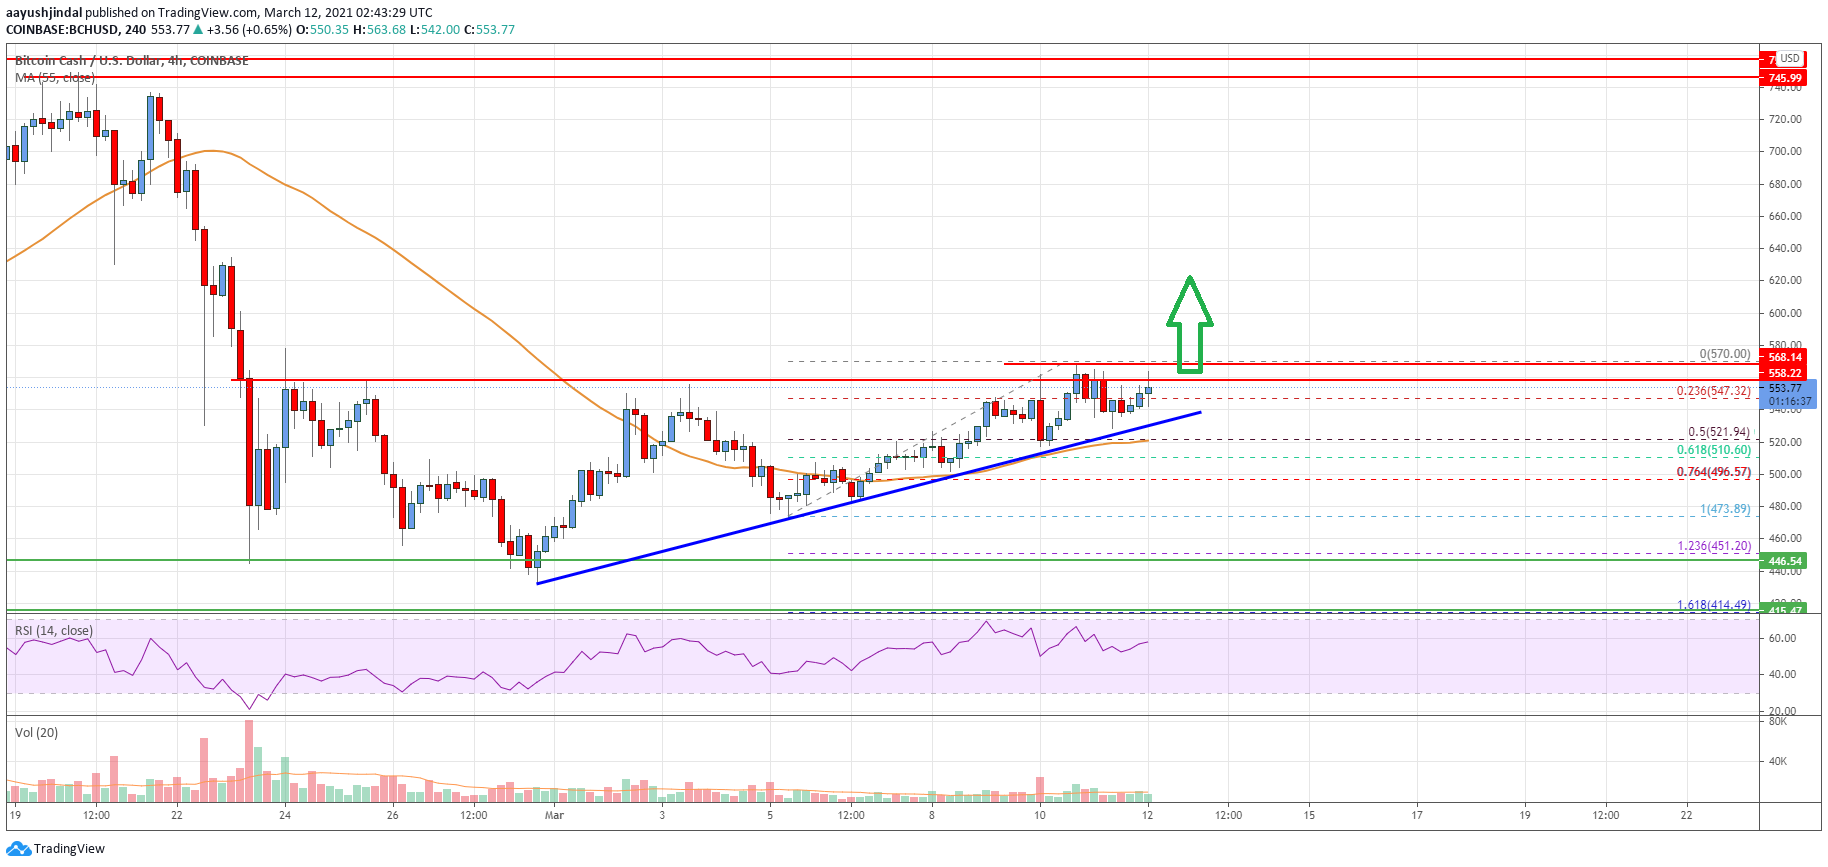
Looking at the chart, bitcoin cash price is clearly trading well above $520 and the 55 simple moving average (4-hours). Overall, the price is likely to start a strong surge if there is a break above $560 and $570 in the near term.
Technical indicators
4 hours MACD – The MACD for BCH/USD is gaining pace in the bullish zone.
4 hours RSI (Relative Strength Index) – The RSI for BCH/USD is now well above the 50 level.
Key Support Levels – $530 and $520.
Key Resistance Levels – $560 and $570.
