
- Bitcoin cash price declined from well above $550 and tested $500 against the US Dollar.
- The price is now trading well below the $550 level and the 55 simple moving average (4-hours).
- There is a major bullish trend line forming with support near $520 on the 4-hours chart of the BCH/USD pair (data feed from Coinbase).
- The pair is likely to start a fresh increase if there is a break above $545 and $550.
Bitcoin cash price is likely preparing for a fresh increase above $550 against the US Dollar, while bitcoin is correcting lower. BCH/USD could rally to $600 if there is a close above $550.
Bitcoin Cash Price Analysis
After testing the $600 resistance zone, bitcoin cash price started a fresh decline. BCH price broke the $580 and $550 support levels to move into a bearish zone.
The decline gained pace below the $550 level and the 55 simple moving average (4-hours). It even spiked to trade near the $500 support zone. A low is formed near $502 and the price is currently correcting higher. It traded above the $520 resistance level.
There was a break above the 23.6% Fib retracement level of the downward move from the $609 high to $502 low. However, the price is now struggling to clear the $545 resistance and the 55 simple moving average (4-hours). The main resistance is near the $550 and $555 levels.
The 50% Fib retracement level of the downward move from the $609 high to $502 low is also near $555. Therefore, the pair is likely to start a fresh increase if there is a break above $550 and $555.
On the downside, the $520 level is a decent support. There is also a major bullish trend line forming with support near $520 on the 4-hours chart of the BCH/USD pair. If there is a downside break below the trend line and $510, there are chances of a sharp decline. The next major support sits near the $480 level.
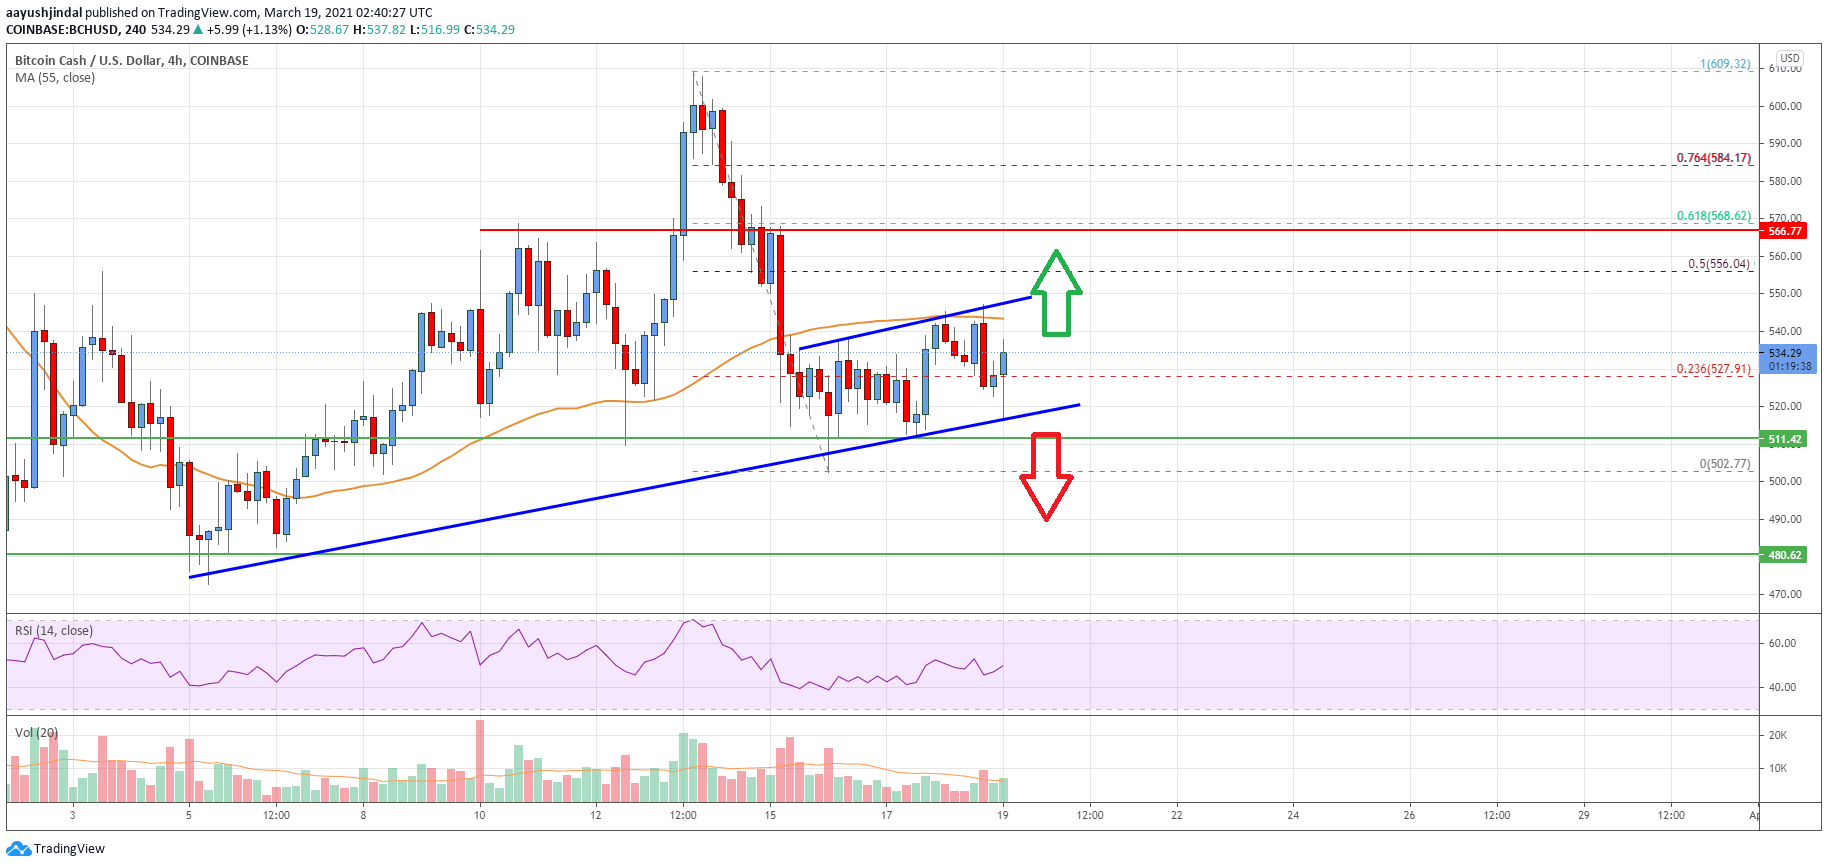
Looking at the chart, bitcoin cash price is clearly trading well below the $550 level and the 55 simple moving average (4-hours). Overall, the price is likely to start a fresh increase if there is a break above $545 and $550 in the near term.
Technical indicators
4 hours MACD – The MACD for BCH/USD is slowly gaining pace in the bullish zone.
4 hours RSI (Relative Strength Index) – The RSI for BCH/USD is rising towards the 50 level.
Key Support Levels – $520 and $510.
Key Resistance Levels – $550 and $555.


Leave a Reply
You must be logged in to post a comment.