- Bitcoin cash price rallied sharply above $550 and $650 against the US Dollar.
- The price traded as high as $774 and settled well above the 55 simple moving average (4-hours).
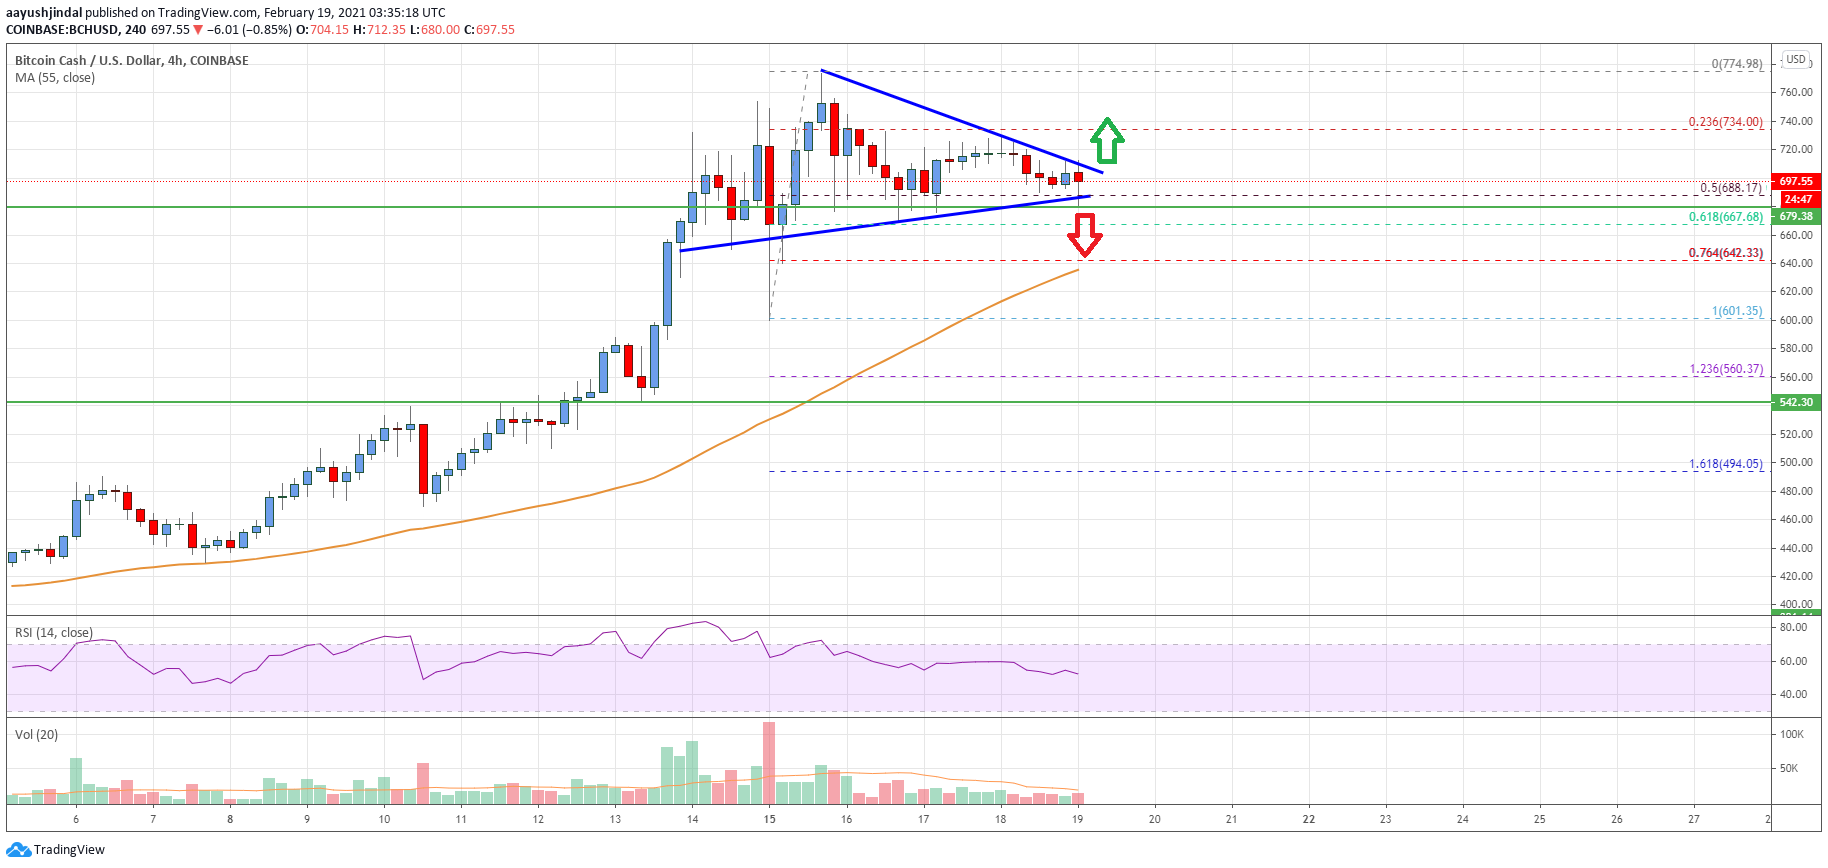
- There is a key contracting triangle forming with support near $688 on the 4-hours chart of the BCH/USD pair (data feed from Coinbase).
- The pair could either correct lower below $680 or it might a fresh rally above $720.
Bitcoin cash price is consolidating gains after a strong rally to $774 against the US Dollar, similar to bitcoin. BCH/USD could start a fresh increase unless it breaks the $600 support.
Bitcoin Cash Price Analysis
After forming a support base above $500, bitcoin cash price started a strong increase. BCH price broke the $550 and $600 resistance levels to move into a positive zone.
The bulls gained strength and pumped the price over 30%. There was also a break above the $700 level and the price settled well above the 55 simple moving average (4-hours). A high is formed near $774 and the price is currently consolidating gains.
There was a break below the $720 support level. The price even traded below the 23.6% Fib retracement level of the recent rally from the $601 swing low to $774 high.
An initial support is near the $685 level. There is also a key contracting triangle forming with support near $688 on the 4-hours chart of the BCH/USD pair. The triangle support is close to the 50% Fib retracement level of the recent rally from the $601 swing low to $774 high.
Any more losses may possibly call for a decline towards the $600 support level and the 55 simple moving average (4-hours). On the upside, the price is facing a key resistance near $705 and $720.
A clear break above the $605 and $620 levels is must for more gains in the near term. The next major resistance is near the $775 level, above which BCH could test $850.

Looking at the chart, bitcoin cash price is clearly trading nicely above the $680 level and the 55 simple moving average (4-hours). Overall, the price could either correct lower below $680 or it might a fresh rally above $720 in the near term.
Technical indicators
4 hours MACD – The MACD for BCH/USD is losing pace in the bullish zone.
4 hours RSI (Relative Strength Index) – The RSI for BCH/USD is still above the 50 level.
Key Support Levels – $685 and $600.
Key Resistance Levels – $720 and $775.


Leave a Reply
You must be logged in to post a comment.