- Bitcoin cash price failed to stay above $1,000 and declined heavily against the US Dollar.
- The price is now trading well below the $850 support level and the 55 simple moving average (4-hours).
- There was a break below a major contracting triangle with support near $910 on the 4-hours chart of the BCH/USD pair (data feed from Coinbase).
- The pair is likely to continue lower towards the $650 and $600 support levels in the near term.
Bitcoin cash price is gaining pace below $900 and $850 against the US Dollar, similar to bitcoin. BCH/USD could retest $600 before it attempts a fresh increase.
Bitcoin Cash Price Analysis
After a steady decline, bitcoin cash price even spiked above the $1,000 level. BCH traded as high as $1,216 before it started a major decline. It broke many supports near the $1,000 and $900 level.
The bears were able to clear the 61.8% Fib retracement level of the upward move from the $654 swing low to $1,216 high. There was also a break below a major contracting triangle with support near $910 on the 4-hours chart of the BCH/USD pair.
The pair is now trading well below the $850 support level and the 55 simple moving average (4-hours). It is also trading below the 76.4% Fib retracement level of the upward move from the $654 swing low to $1,216 high.
The next major support is near the $650 level or the $654 low. Any more losses might call for a test of the $600 support. The main support could be $520. It is near the 1.2.36 Fib extension level of the upward move from the $654 swing low to $1,216 high.
On the upside, an immediate resistance is near the $760 level. The first major resistance is near the $850 level (the recent breakdown zone). A clear break above the $850 resistance could set the pace for a move towards the $1,000 level.
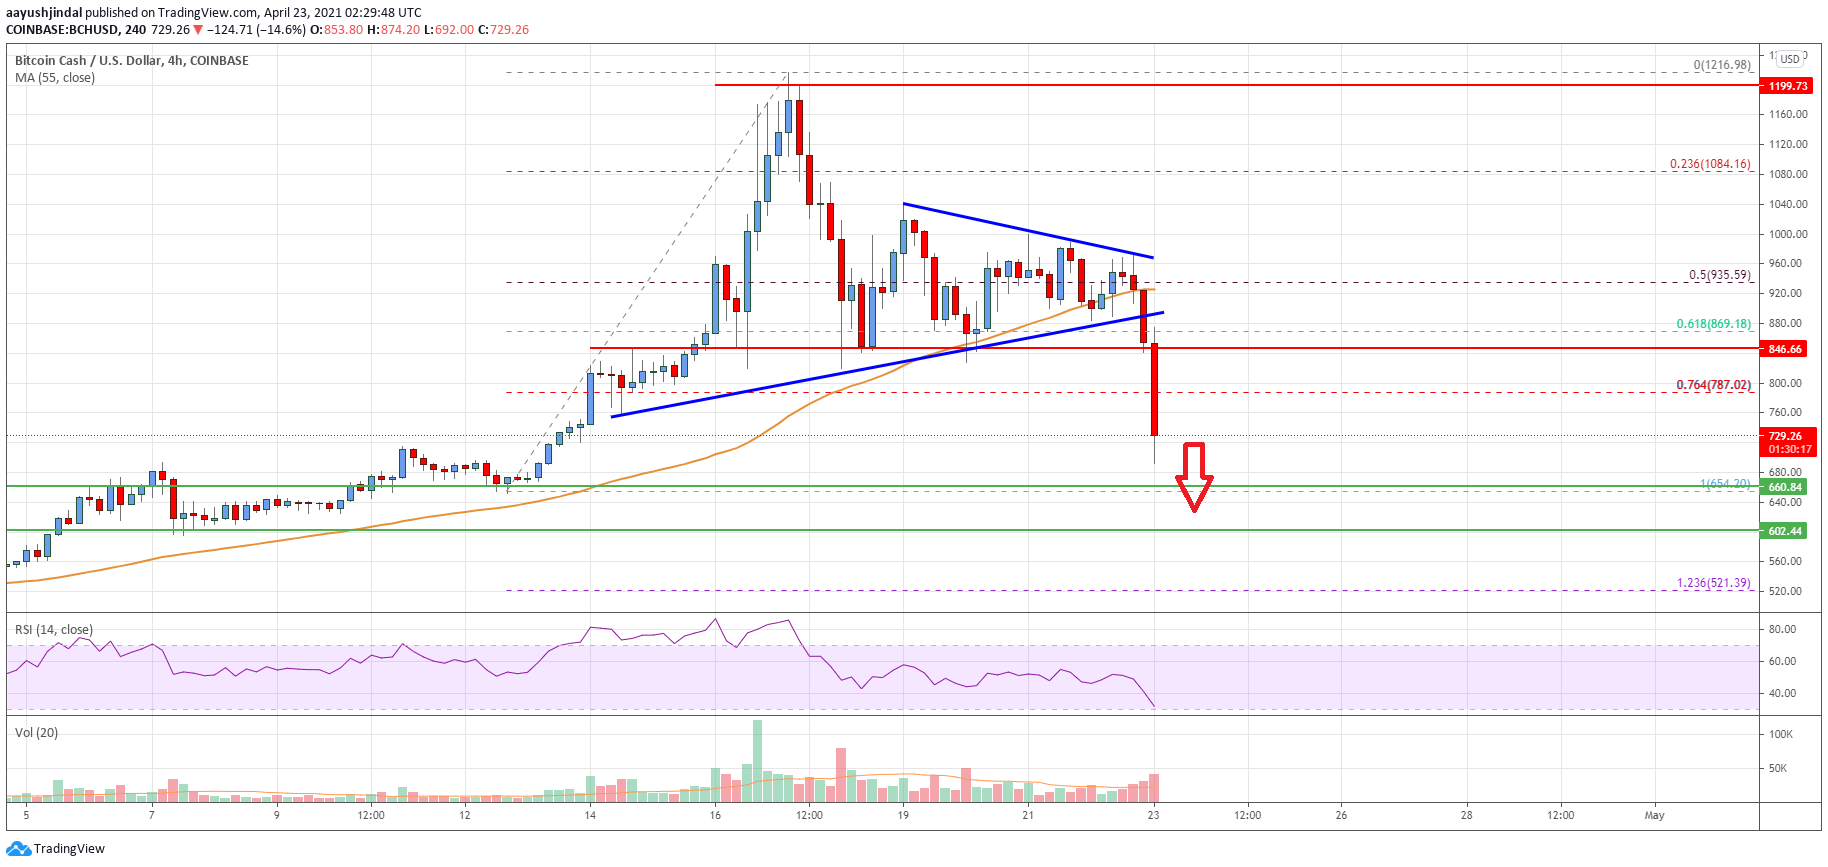
Looking at the chart, bitcoin cash price is clearly trading well below the $850 level and the 55 simple moving average (4-hours). Overall, the price is likely to continue lower towards the $650 and $600 support levels in the near term.
Technical indicators
4 hours MACD – The MACD for BCH/USD is now gaining pace in the bearish zone.
4 hours RSI (Relative Strength Index) – The RSI for BCH/USD is well below the 50 level.
Key Support Levels – $650 and $600.
Key Resistance Levels – $850 and $1,000.


Leave a Reply
You must be logged in to post a comment.