- Bitcoin price started a sharp decline and it tested the $51,250 zone against the US Dollar.
- The price is now trading well below $58,000 and the 55 simple moving average (4-hours).
- There is a major bearish trend line forming with resistance near $58,200 on the 4-hours chart of the BTC/USD pair (data feed from Coinbase).
- The pair could start a fresh rally if it breaks the $58,000 and $58,200 resistance levels.
Bitcoin price declined sharply from well above $60,000 against the US Dollar. BTC is now consolidating losses and it is facing a major hurdle near the $58,000 zone.
Bitcoin Price Analysis
Recently, bitcoin price saw a strong decline from well above the $60,000 level against the US Dollar. BTC broke many supports near the $58,000 and $55,000 levels.
It even spiked below the $52,000 level and settled below the 55 simple moving average (4-hours). A low is formed near $51,289 and the price is now consolidating losses. It recovered slightly above the $54,000 and $55,000 resistance levels.
However, it is facing resistance near the $57,500 level. The 50% Fib retracement level of the key decline from the $62,617 swing high to $51,289 low is acting as a resistance.
The next major resistance is near the $58,000 zone. There is also a major bearish trend line forming with resistance near $58,200 on the 4-hours chart of the BTC/USD pair. The trend line is close to the 61.8% Fib retracement level of the key decline from the $62,617 swing high to $51,289 low.
A successful break and close above $58,000 and the trend line resistance could open the doors for a steady increase. The next major resistance could be $60,000.
On the downside, the $55,000 level is a major support. The main breakdown support is near the $54,000 level, below which there could be a sharp decline towards $50,000.
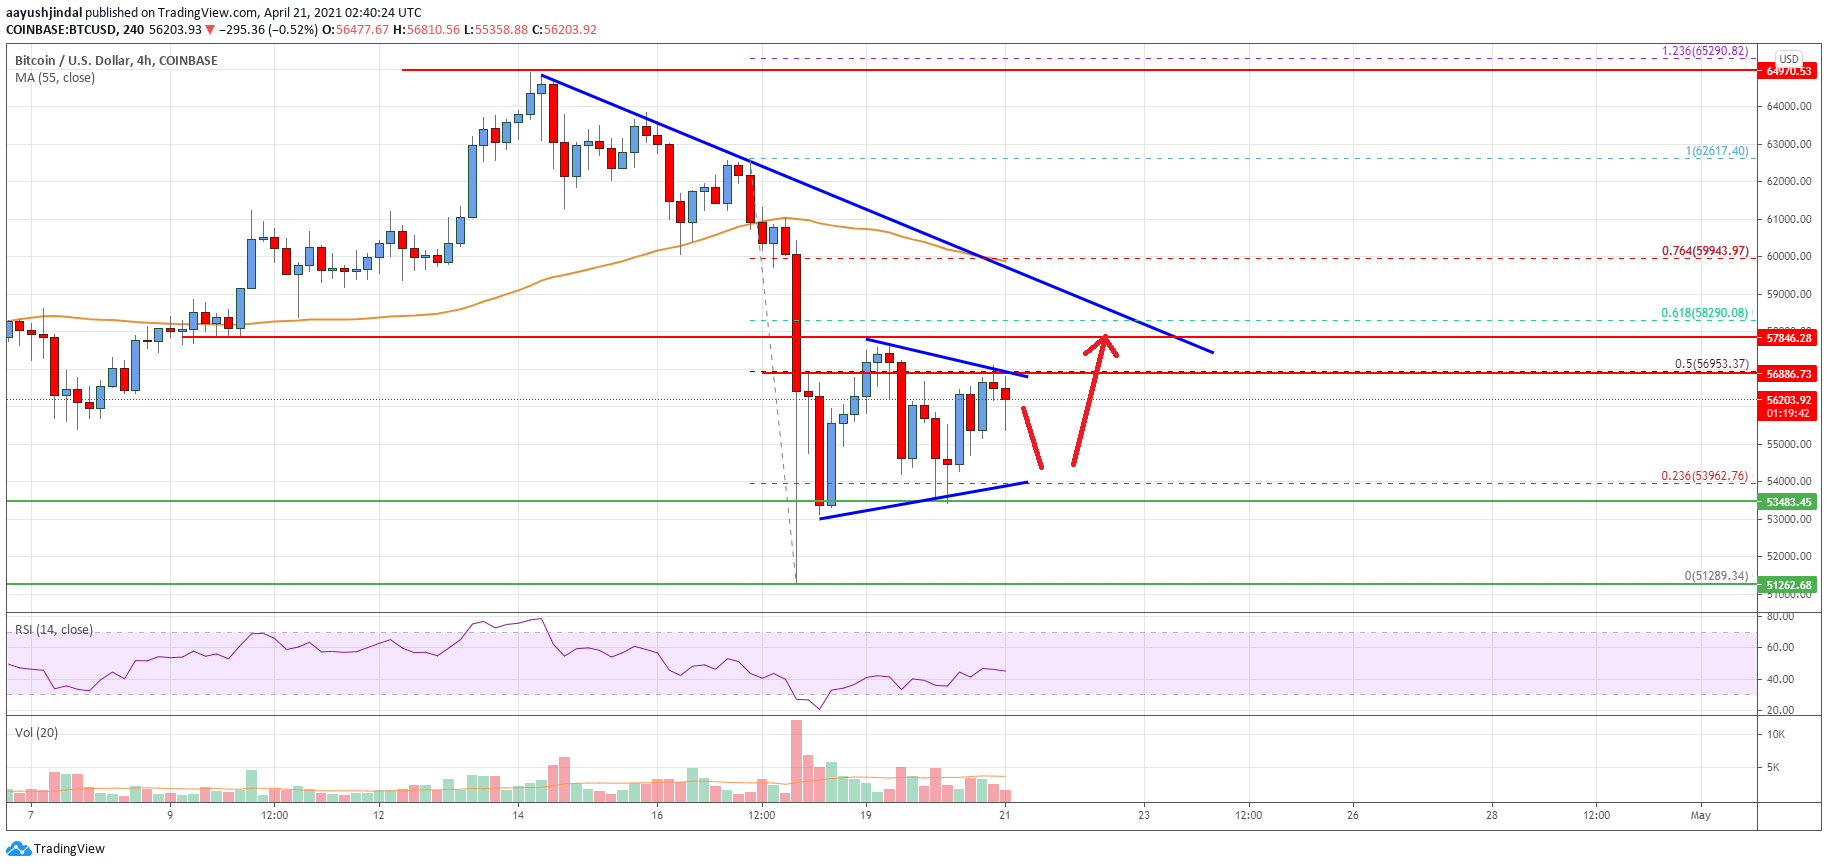
Looking at the chart, bitcoin price is clearly facing hurdles near $58,000 and the 55 simple moving average (4-hours). Overall, the price could start a fresh rally if it breaks the $58,000 and $58,200 resistance levels.
Technical indicators
4 hours MACD – The MACD is slowly losing momentum in the bearish zone.
4 hours RSI (Relative Strength Index) – The RSI is just below the 50 level.
Key Support Levels – $55,000 and $54,000.
Key Resistance Levels – $57,500, $58,000 and $60,000.
