- Bitcoin price extended its rise above the $64,000 resistance against the US Dollar.
- The price is now trading above the $61,500 support and the 55 simple moving average (4-hours).
- There is a major bullish trend line forming with support near $61,080 on the 4-hours chart of the BTC/USD pair (data feed from Coinbase).
- The pair could start a fresh rally above $63,000 as long as there is no close below $60,000.
Bitcoin price extended its rally to a new all-time high above $64,500 against the US Dollar. BTC is correcting gains, but it remains well bid above the $60,000 zone.
Bitcoin Price Analysis
In the past few sessions, bitcoin price saw a strong increase above the $60,000 resistance against the US Dollar. BTC even traded above the $62,000 level and extended its rally above $64,000.
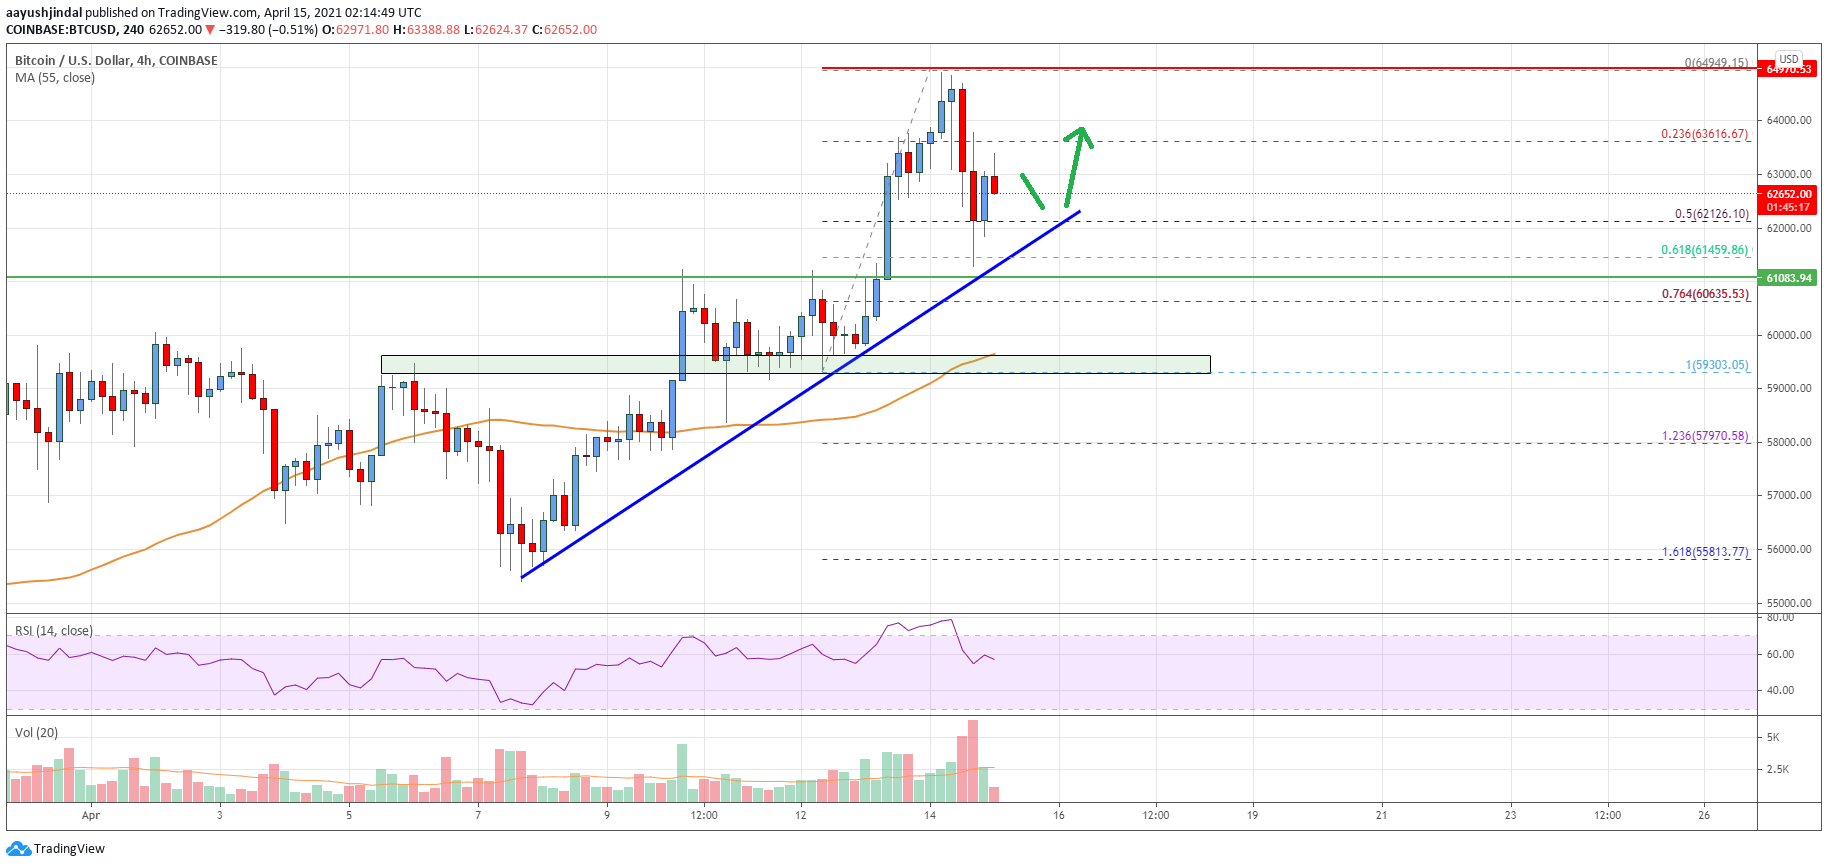
It traded to a new all-time high at $64,950 before starting a downside correction. There was a break below the $64,000 support zone. The price declined below the 50% Fib retracement level of the upward wave from the $59,300 swing low to $64,950 swing high.
It is now trading nicely above the $61,500 support and the 55 simple moving average (4-hours). There was a test of the 61.8% Fib retracement level of the upward wave from the $59,300 swing low to $64,950 swing high.
There is also a major bullish trend line forming with support near $61,080 on the 4-hours chart of the BTC/USD pair. The pair is now showing positive signs above the $62,000 level. The first major resistance on the upside is near the $63,600 level.
The next major hurdle is near the $64,000 level. A clear break above the $64,000 barrier could open the doors for a move towards the $65,000 and $65,500 levels.
On the downside, the $62,000 level is a major support. The main breakdown support is near the $61,000 level, below which there could be a sharp decline towards $59,300.
Looking at the chart, bitcoin price is clearly trading in a positive zone above $62,000 and the 55 simple moving average (4-hours). Overall, the price could start a fresh rally above $63,000 as long as there is no close below $60,000.
Technical indicators
4 hours MACD – The MACD is slowly losing momentum in the bullish zone.
4 hours RSI (Relative Strength Index) – The RSI is still well above the 50 level.
Key Support Levels – $62,000 and $61,000.
Key Resistance Levels – $63,600, $64,000 and $65,000.