- Bitcoin price started a fresh increase from the $55,000 support zone against the US Dollar.
- The price is now trading above the $57,000 support and the 55 simple moving average (4-hours).
- There was a break above a major bearish trend line with resistance near $56,000 on the 4-hours chart of the BTC/USD pair (data feed from Coinbase).
- The pair is likely to continue higher towards $60,000 and $61,500 in the near term.
Bitcoin price is showing positive signs above $57,000 against the US Dollar. BTC could accelerate higher towards the $61,800 level as long as it is above $55,250.
Bitcoin Price Analysis
In the past few days, bitcoin price saw a steady increase above the $55,000 resistance against the US Dollar. BTC formed a base above the $54,000 level before starting the current increase.
During the rise, there was a break above the $55,500 resistance zone and the 55 simple moving average (4-hours). The pair climbed above the 50% Fib retracement level of the downward move from the $60,160 swing high to $50,350 low.
There was also a break above a major bearish trend line with resistance near $56,000 on the 4-hours chart of the BTC/USD pair. The pair is now trading above the $57,000 support and the 55 simple moving average (4-hours).
It seems to be consolidating above the 76.4% Fib retracement level of the downward move from the $60,160 swing high to $50,350 low. On the upside, the first key resistance is near the $60,000 and $60,160 levels. A clear close above the $60,000 zone could open the doors for a sharp acceleration towards the $61,500 level.
The next major resistance sits at $61,800, above which the price could test $62,500. On the downside, the $58,000 level is a major breakdown support. The next major support is near the $55,250 level and the 55 simple moving average (4-hours), below which there could be a sharp decline towards $52,000.
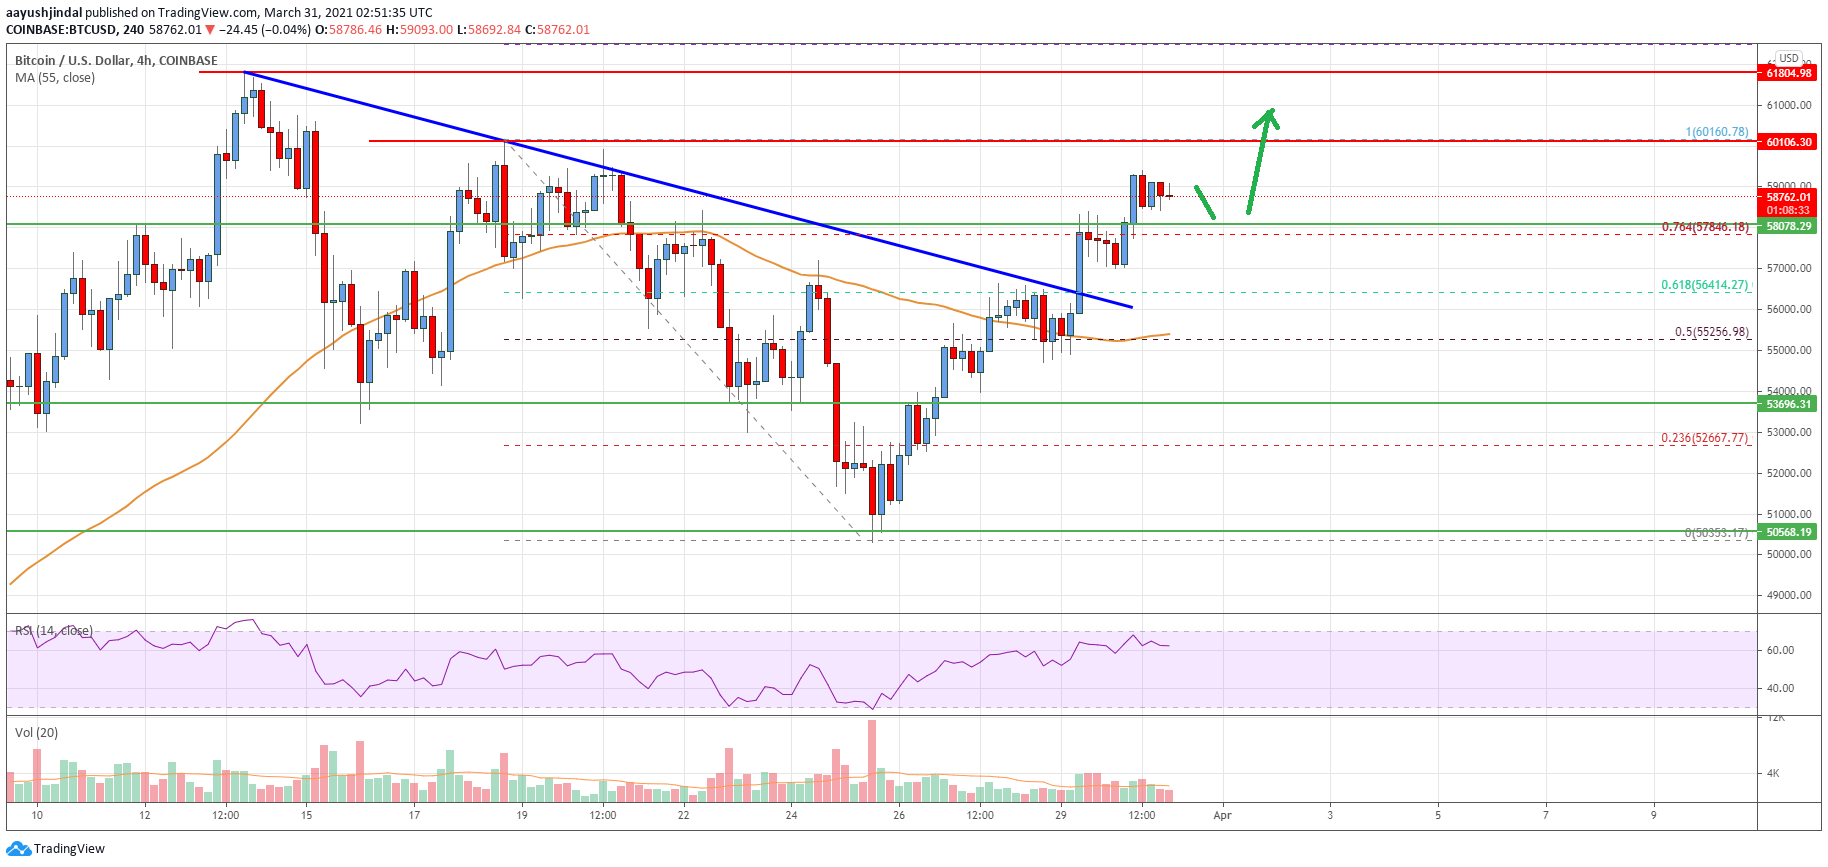
Looking at the chart, bitcoin price is clearly trading nicely above the $57,000 zone and the 55 simple moving average (4-hours). Overall, the price is likely to continue higher towards $60,000 and $61,500 in the near term.
Technical indicators
4 hours MACD – The MACD is slowly gaining momentum in the bullish zone.
4 hours RSI (Relative Strength Index) – The RSI is well above the 50 level.
Key Support Levels – $58,000 and $57,000.
Key Resistance Levels – $60,000, $61,000 and $61,800.


Leave a Reply
You must be logged in to post a comment.