- Tron price started a fresh increase from the $0.0540 support zone against the US Dollar.
- TRX price is now trading above the $0.0650 support and the 55 simple moving average (4-hours).
- There was a break above a major contracting triangle with resistance near $0.0670 on the 4-hours chart (data feed via Bitfinex).
- The pair is likely to accelerate higher if it clears the $0.0690 and $0.0700 resistance levels in the near term.
TRON price is trading in a positive zone above $0.0650 against the US Dollar, similar to bitcoin. TRX price must remain above $0.0615 to continue higher in the near term.
Tron Price Analysis
After forming a support base near $0.0550, tron price started a fresh increase against the US Dollar. TRX price broke the $0.0580 and $0.0600 resistance levels.
The price even broke the $0.0650 resistance level and settled well above the 55 simple moving average (4-hours). There was also a break above a major contracting triangle with resistance near $0.0670 on the 4-hours chart.
The pair traded as high as $0.0690 and it is currently correcting lower. It tested the 23.6% Fib retracement level of the upward move from the $0.0619 low to $0.0690 high. The first key support on the downside is near the $0.0655 and $0.0650 levels.
The 50% Fib retracement level of the upward move from the $0.0619 low to $0.0690 high is also near the $0.0655 level to provide support. If there are more losses, tron price could decline towards the $0.0620 support zone
The 55 simple moving average (4-hours) is also near $0.0620 to provide support. On the upside, the $0.0690 and $0.0700 levels are key hurdles. A clear break above the $0.0700 level may possibly open the doors for a move towards the $0.0800 level. Any more gains might call for a steady increase towards the main $0.1000 barrier it the coming days.
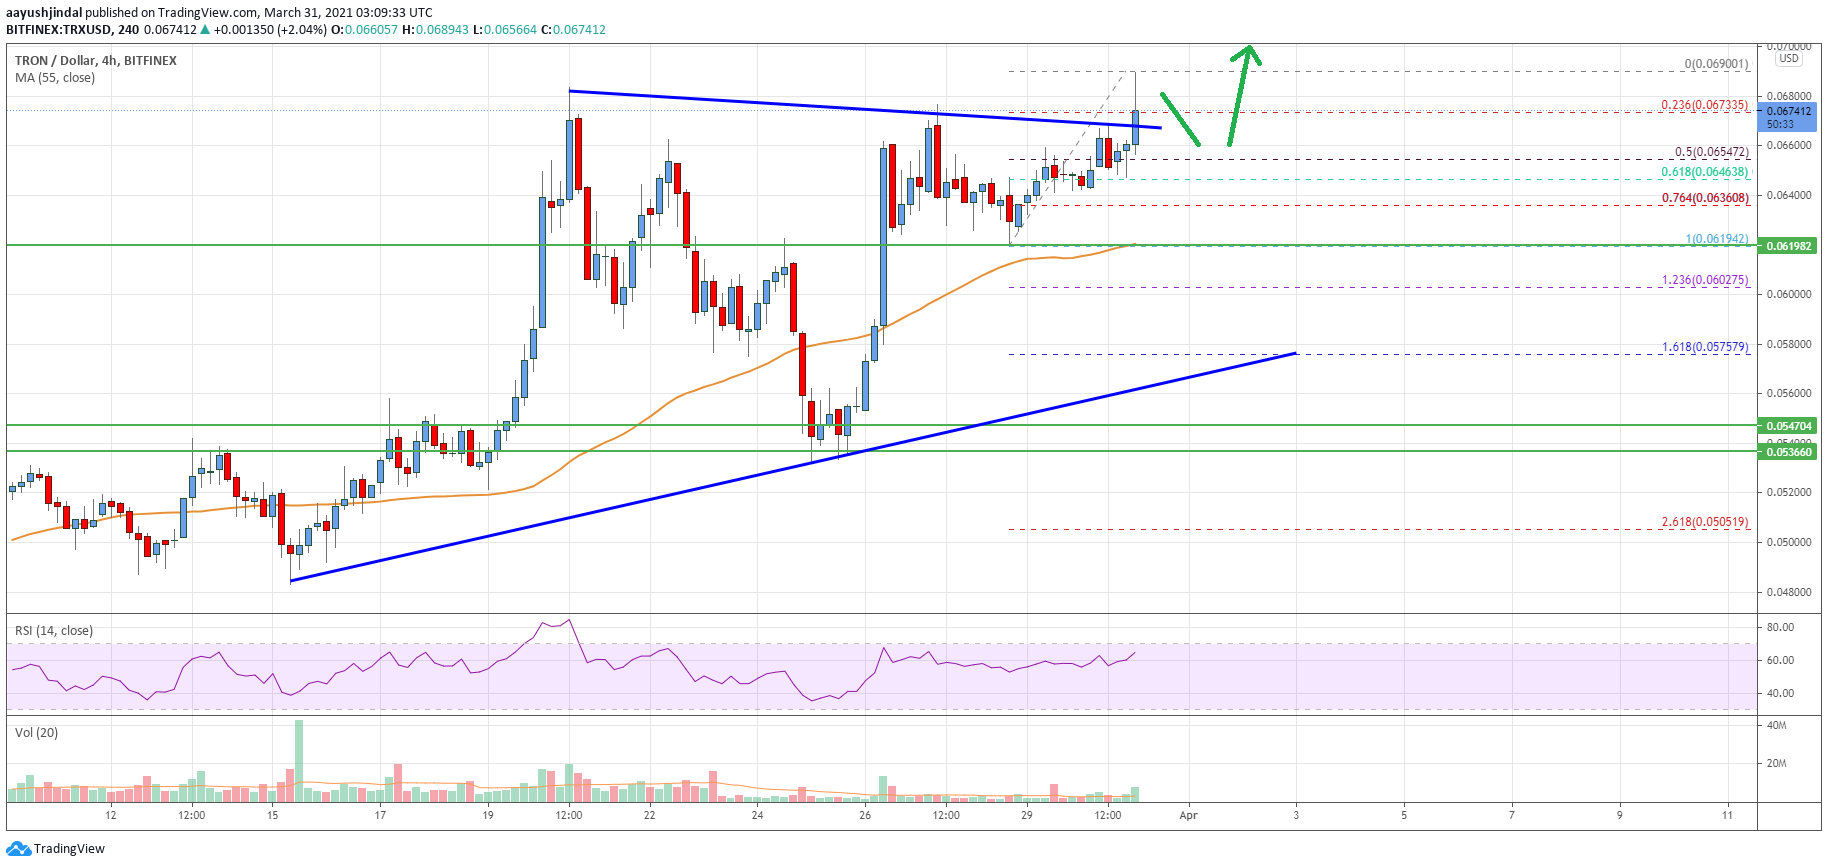
The chart indicates that TRX price is clearly trading above the $0.0550 support and the 55 simple moving average (4-hours). Overall, the price is likely to accelerate higher if it clears the $0.0690 and $0.0700 resistance levels in the near term.
Technical Indicators
4 hours MACD – The MACD for TRX/USD is slowly gaining momentum in the bullish zone.
4 hours RSI – The RSI for TRX/USD is well above the 50 level.
Key Support Levels – $0.0550 and $0.0520.
Key Resistance Levels – $0.0690, $0.0700 and $0.0800.
