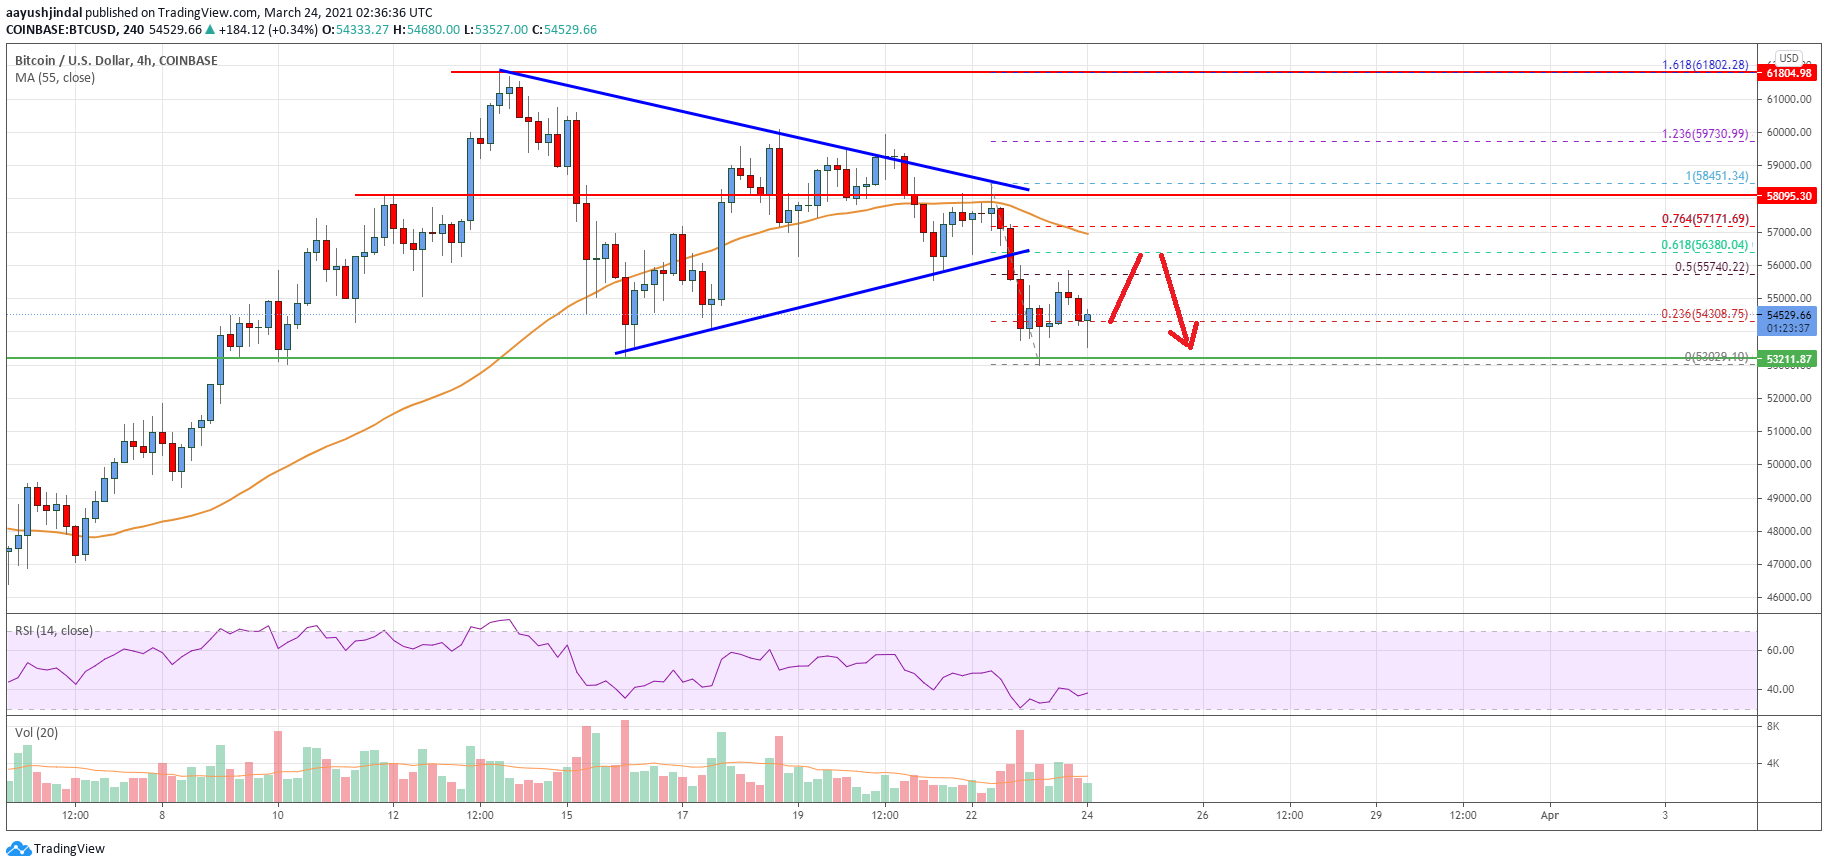
- Bitcoin price started a fresh decline from well above $58,000 against the US Dollar.
- The price is now trading below the $55,000 support and the 55 simple moving average (4-hours).
- There was a break below a key contracting triangle with support near $56,000 on the 4-hours chart of the BTC/USD pair (data feed from Coinbase).
- The pair is likely to continue lower below the $53,200 and $53,000 support levels in the near term.
Bitcoin price is holding a major support above $53,000 against the US Dollar. BTC could dive if there is a clear break below the $53,000 support zone.
Bitcoin Price Analysis
In the past few days, bitcoin price saw a steady decline below the $60,000 support against the US Dollar. BTC settled below the key $58,000 pivot level and the 55 simple moving average (4-hours).
There was also a break below the $56,200 and $55,000 support levels. During the recent decline, there was a break below a key contracting triangle with support near $56,000 on the 4-hours chart of the BTC/USD pair. However, the bulls were able to protect the key $53,200 support zone.
The pair traded as low as $53,029 and it is now consolidating above $53,200. An initial resistance is near the $55,740 level. It is near the 50% Fib retracement level of the recent decline from the $58,451 high to $53,029 low.
The next major resistance sits at $57,000 zone and the 55 simple moving average (4-hours). The 76.4% Fib retracement level of the recent decline from the $58,451 high to $53,029 low is also near the $57,000 resistance zone.
A clear break above the $57,000 resistance could open the doors for a break above $58,000. In the stated case, the pair could rise steadily towards the $60,000 and $60,500 levels.
On the downside, the $53,200 level is a crucial breakdown support. The next major support is near the $53,000 level, below which there could be a sharp decline towards $50,000.

Looking at the chart, bitcoin price is clearly struggling near $53,200 and it is below the 55 simple moving average (4-hours). Overall, the price is likely to continue lower below the $53,200 and $53,000 support levels in the near term.
Technical indicators
4 hours MACD – The MACD is slowly gaining momentum in the bearish zone.
4 hours RSI (Relative Strength Index) – The RSI is well below the 50 level.
Key Support Levels – $53,200 and $50,000.
Key Resistance Levels – $55,740, $57,000 and $58,000.


Leave a Reply
You must be logged in to post a comment.