- Bitcoin price failed to clear the $60,000 resistance and corrected lower against the US Dollar.
- The price is now trading below the $58,500 support and the 55 simple moving average (4-hours).
- There is a major contracting triangle forming with resistance near $58,650 on the 4-hours chart of the BTC/USD pair (data feed from Coinbase).
- The pair could start a strong rally if there is a clear break above the $58,650 and $58,800 resistance levels.
Bitcoin price is trading in a range above $57,000 against the US Dollar. BTC must stay above $56,600 to avoid a sharp decline in the near term.
Bitcoin Price Analysis
In the past few sessions, bitcoin price saw a steady increase above the $58,000 resistance against the US Dollar. BTC even traded above the $59,000 level, but it failed to continue higher.
A high was formed near $59,548 before the pair started a downside correction. There was a break below the $58,000 support zone and the 55 simple moving average (4-hours). The pair even traded below the $57,500 support zone, but the bulls appeared near $57,250.
A low is formed near $57,240 and the price is now consolidating losses. An initial resistance is near the $58,400 level and the 55 simple moving average (4-hours).
The 50% Fib retracement level of the downward move from the $59,548 swing high to $57,240 low is also near the $58,400 level. Moreover, it seems like there is a major contracting triangle forming with resistance near $58,650 on the 4-hours chart of the BTC/USD pair.
To start a strong increase, the price must clear the $58,400 and $58,650 resistance levels. The next major resistance sits at $59,500, above which the price could test $60,000. In the stated case, the price could even rally towards $62,000.
On the downside, the $57,500 level is a major support. The main breakdown support is near the $56,600 level, below which there could be a sharp decline towards $52,000.
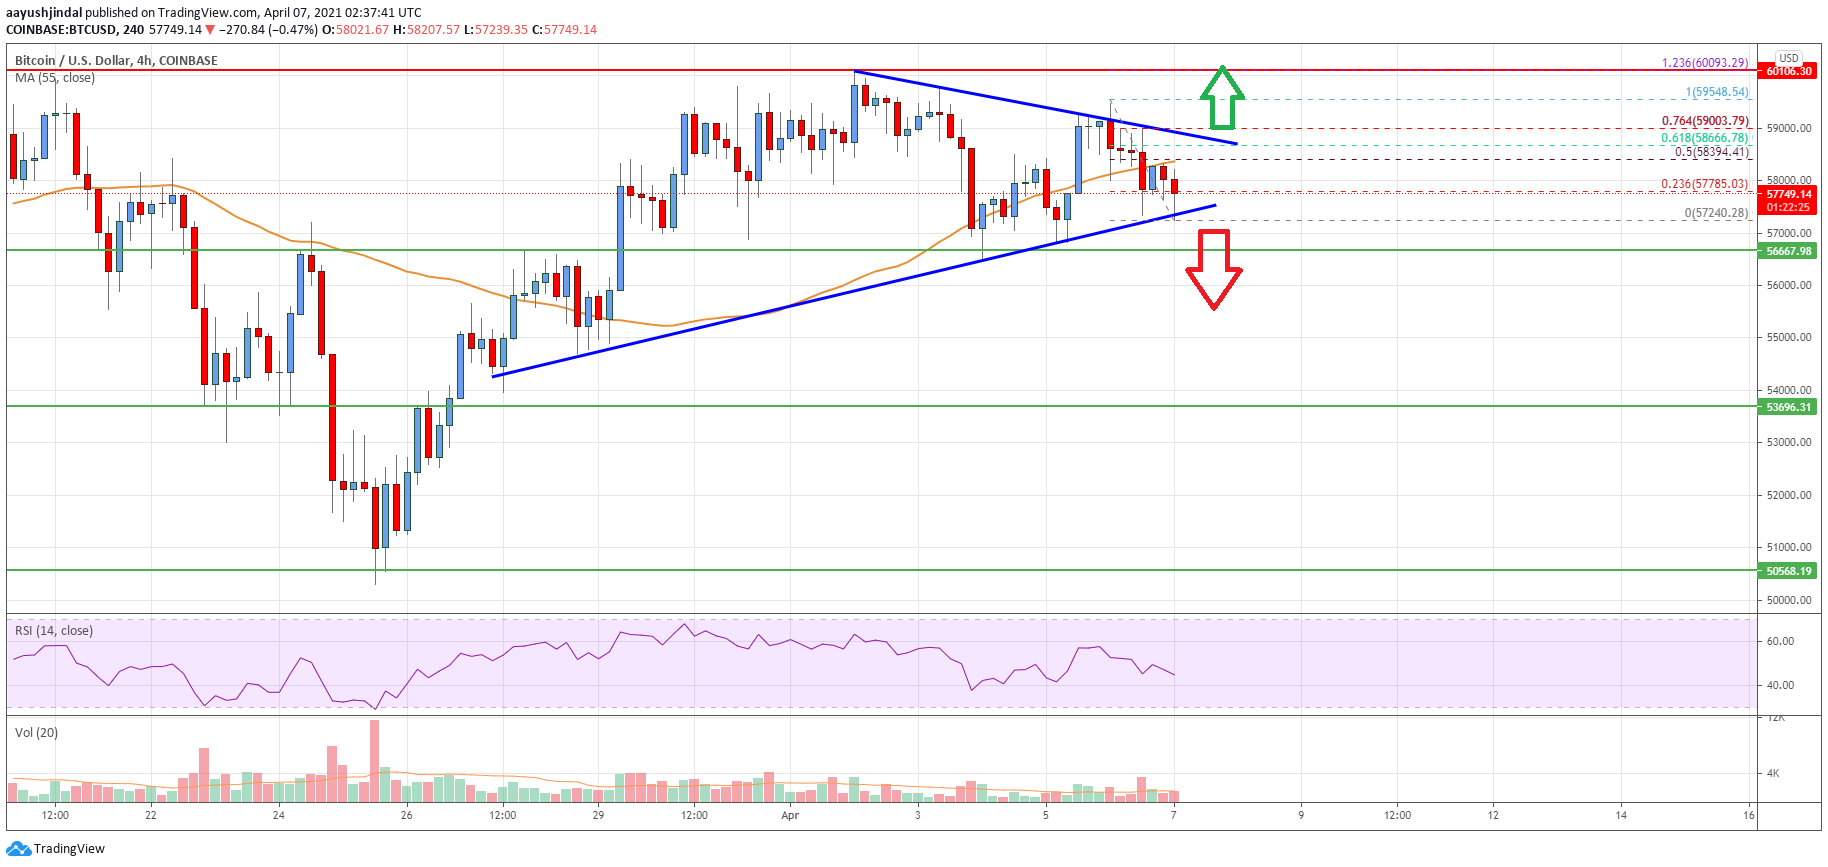
Looking at the chart, bitcoin price is clearly preparing for the next move and trading below the 55 simple moving average (4-hours). Overall, the price could start a strong rally if there is a clear break above the $58,650 and $58,800 resistance levels.
Technical indicators
4 hours MACD – The MACD is slowly losing momentum in the bullish zone.
4 hours RSI (Relative Strength Index) – The RSI is just below the 50 level.
Key Support Levels – $57,500 and $56,600.
Key Resistance Levels – $58,400, $58,650 and $60,000.