- Bitcoin cash price is struggling to gain momentum above $650 and $700 against the US Dollar.
- The price is now trading well below $650 and the 55 simple moving average (4-hours).
- There is a major bearish trend line forming with resistance near $650 on the 4-hours chart of the BCH/USD pair (data feed from Coinbase).
- The pair could extend its decline unless there is a clear break above $650 and $665.
Bitcoin cash price is struggling to recover above $650 against the US Dollar, similar to bitcoin. BCH/USD remains at a risk of more downsides below $550.
Bitcoin Cash Price Analysis
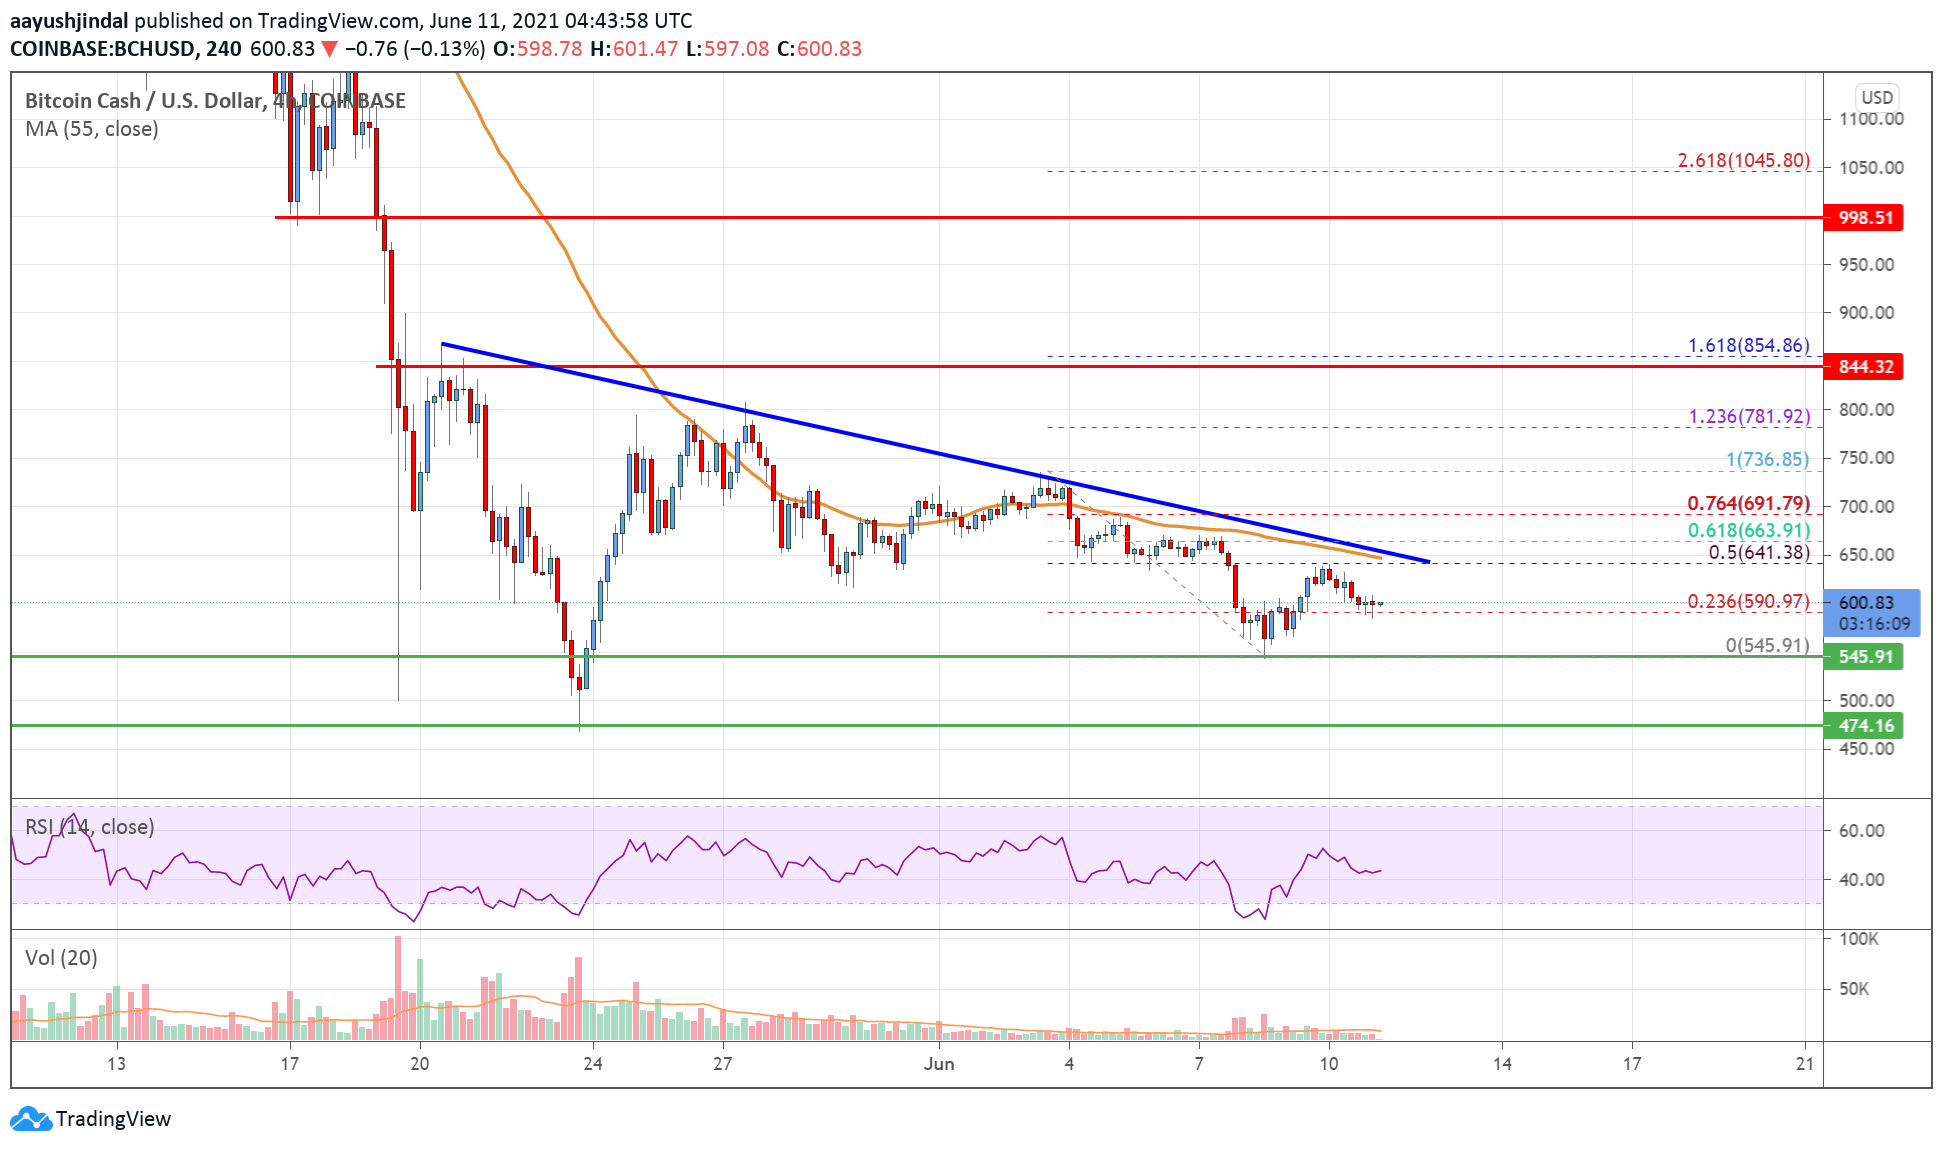
After facing hurdles near $750, bitcoin cash price started a fresh decline. BCH broke the $650 support level and the 55 simple moving average (4-hours) to move into a bearish zone.
There was also a break below the $600 level. The price traded as low as $545 and it is now correcting higher. There was a break above the $600 level. The price climbed above the 23.6% Fib retracement level of the recent decline from the $736 high to $545 low.
However, it is facing resistance near $635 and $650. It is now trading well below $650 and the 55 simple moving average (4-hours). There is also a major bearish trend line forming with resistance near $650 on the 4-hours chart of the BCH/USD pair.
The trend line and $650 are close to the 55 simple moving average (4-hours). It also coincides with the 50% Fib retracement level of the recent decline from the $736 high to $545 low.
Therefore, a clear break above $650 is must to start a steady increase. The next key resistance is near $665, above which the price could clear $700. An initial support on the downside is near the $580 level. The next major support is near the $550 level, below which bitcoin cash price could dive towards the $500 level.

Looking at the chart, bitcoin cash price is clearly trading well below $650 and the 55 simple moving average (4-hours). Overall, the price is could extend its decline unless there is a clear break above $650 and $665.
Technical indicators
4 hours MACD – The MACD for BCH/USD is now losing pace in the bullish zone.
4 hours RSI (Relative Strength Index) – The RSI for BCH/USD is just below the 50 level.
Key Support Levels – $550 and $500.
Key Resistance Levels – $650 and $700.


Leave a Reply
You must be logged in to post a comment.