- Bitcoin cash price is holding ground above the key $242 support zone against the US Dollar.
- The price is now trading above the $252 support and the 55 simple moving average (4-hours).
- There is a major declining channel forming with resistance near $258 on the 4-hours chart of the BCH/USD pair (data feed from Coinbase).
- The pair could rally significantly if it clears the $258 and $260 resistance levels.
Bitcoin cash price is rising steadily above $250, similar to bitcoin above $18k against the US Dollar. BCH/USD is likely to break higher as long as it is above $242.
Bitcoin Cash Price Analysis
This week, bitcoin cash price trimmed gains and traded below the $260 and $255 levels against the US Dollar. BCH price even broke the $250 level and the 55 simple moving average (4-hours).
However, the bulls remained active near the $240 and $242 levels. It seems like there is a strong support base forming near the $242 level. The recent low was formed near $241 and the price is currently rising.
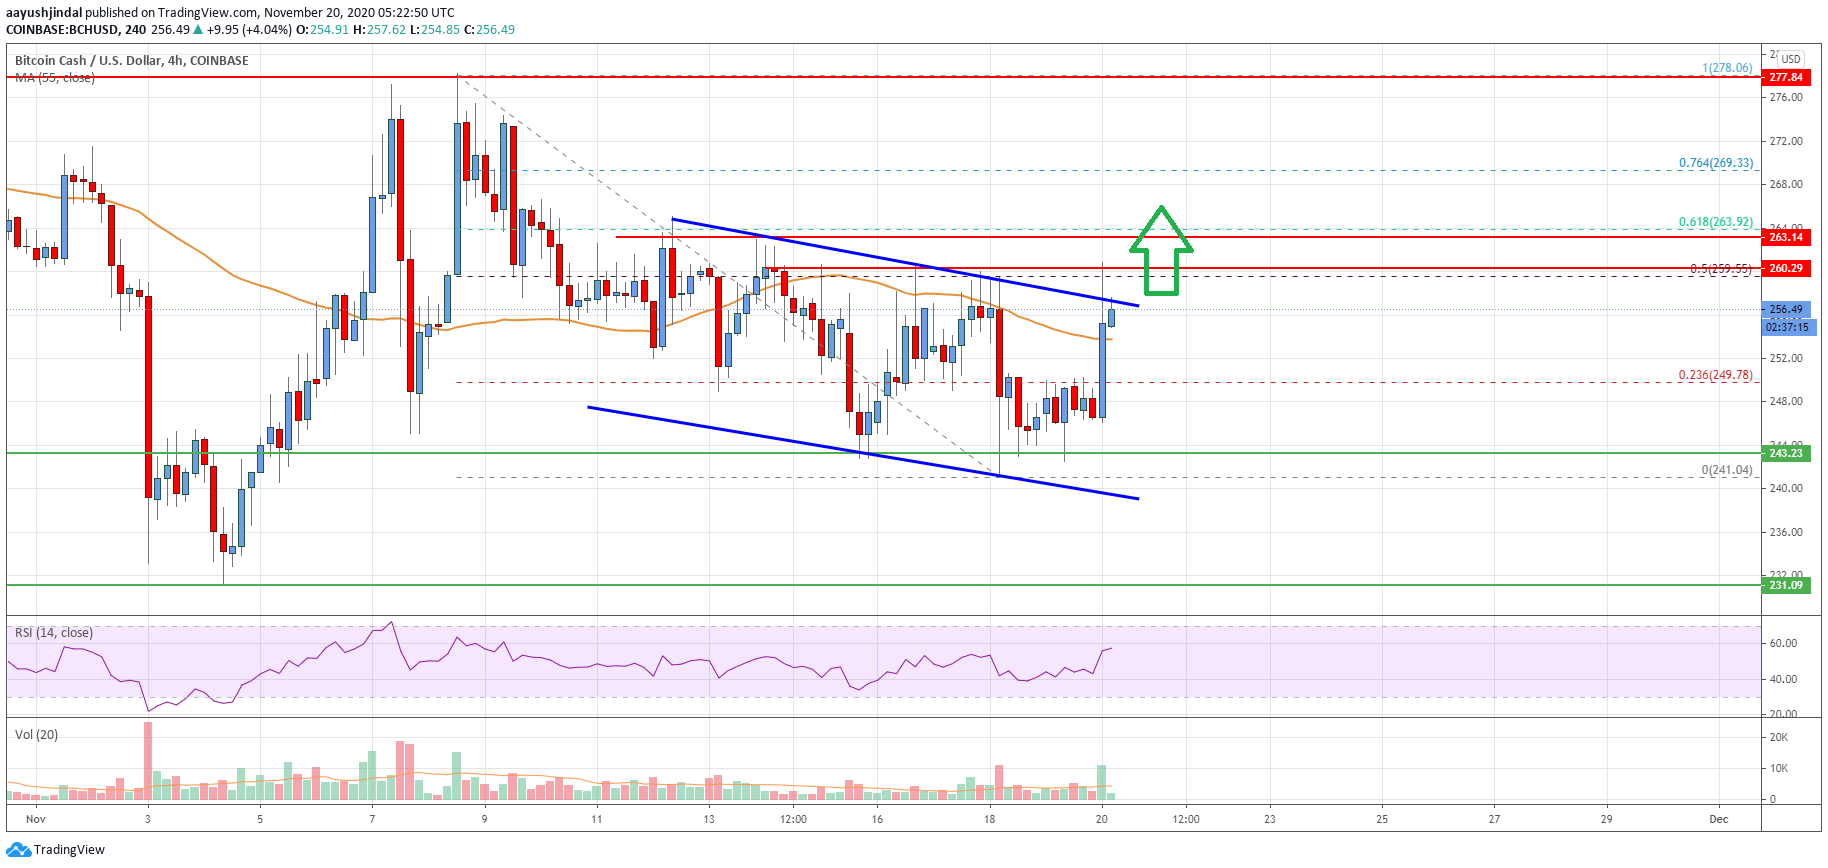
It is trading above the $250 resistance level. There was a break above the 23.6% Fib retracement level of the downward move from the $278 swing high to $241 low. The price is now trading above the $252 support and the 55 simple moving average (4-hours).
On the upside, there are many important hurdles near $258 and $260. There is also a major declining channel forming with resistance near $258 on the 4-hours chart of the BCH/USD pair.
The 50% Fib retracement level of the downward move from the $278 swing high to $241 low is also near the channel resistance at $260. Therefore, the price could start a strong rally if there is clear break above the $258 and $260 resistance levels.
Conversely, the price could fail to clear the $260 barrier. An initial support on the downside is near $252. The main support is near the $242 level, below which the price dive towards the $232 level.
Looking at the chart, bitcoin cash price is clearing facing a strong resistance near $258 and $260. Overall, the price could rally significantly if it clears the $258 and $260 resistance levels.
Technical indicators
4 hours MACD – The MACD for BCH/USD is slowly gaining pace in the bullish zone.
4 hours RSI (Relative Strength Index) – The RSI for BCH/USD is currently well above the 50 level.
Key Support Levels – $252 and $242.
Key Resistance Levels – $260 and $275.