
- Bitcoin cash price started a fresh decline below the $320 support against the US Dollar.
- The price is now trading below the $285 zone and the 55 simple moving average (4-hours).
- There is a key bearish trend line forming with resistance near $290 on the 4-hours chart of the BCH/USD pair (data feed from Coinbase).
- The pair could continue to move down if there is no upside break above $300.
Bitcoin cash price is showing bearish signs below $290 against the US Dollar, similar to bitcoin. BCH/USD could extend losses unless there is a move above $300.
Bitcoin Cash Price Analysis
Bitcoin cash price started a major decline below the $350 support zone. BCH price declined below the $300 support and the 55 simple moving average (4-hours).
The price accelerated lower and even settled below the $280 level. Finally, there was a spike below the $260 level. A low is formed near $259, and the price is now correcting losses. An immediate resistance on the upside is near the $290 level and the 55 simple moving average (4-hours).
It is near the 23.6% Fib retracement level of the downward move from the $398 swing high to $260 low. There is also a key bearish trend line forming with resistance near $290 on the 4-hours chart of the BCH/USD pair.
The next major resistance is near the $300 level. A clear break above $300 and $302 might start a fresh increase. In the stated case, the price could rise towards the $330 level. It is near the 50% Fib retracement level of the downward move from the $398 swing high to $260 low.
If there is no upside break, the price could decline below $270. The next major support is near the $260 level, below which the bears gain strength. The next target for them may perhaps be near the $220 level.
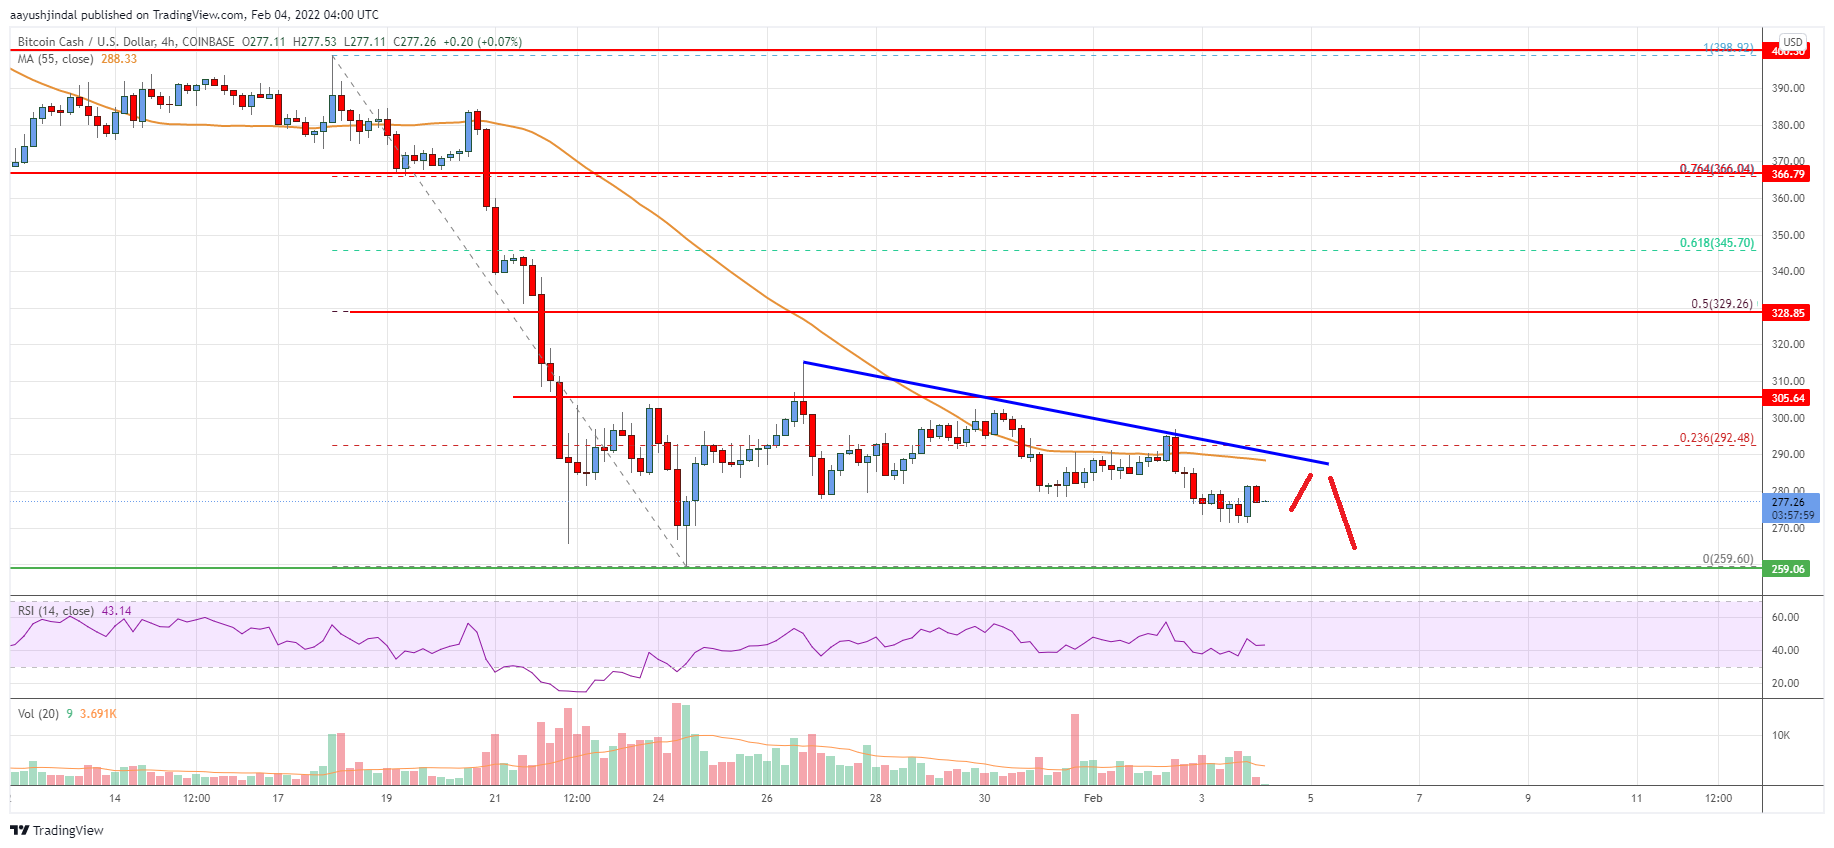
Looking at the chart, bitcoin cash price is now trading below the $285 zone and the 55 simple moving average (4-hours). Overall, the price could continue to move down if there is no upside break above $300.
Technical indicators
4 hours MACD – The MACD for BCH/USD is slowly losing pace in the bearish zone.
4 hours RSI (Relative Strength Index) – The RSI for BCH/USD is now below the 50 level.
Key Support Levels – $270 and $260.
Key Resistance Levels – $290 and $300.


Leave a Reply
You must be logged in to post a comment.