
- Bitcoin cash price failed to stay above $510 and $500 against the US Dollar.
- The price is now trading well below the $500 level and the 55 simple moving average (4-hours).
- There is a major bearish trend line forming with resistance near $505 on the 4-hours chart of the BCH/USD pair (data feed from Coinbase).
- The pair could correct higher, but upsides are likely to be capped near $500 and $510.
Bitcoin cash price is consolidating losses above $445 against the US Dollar, similar to bitcoin. BCH/USD could recover, but the bears are likely to remain active near $500.
Bitcoin Cash Price Analysis
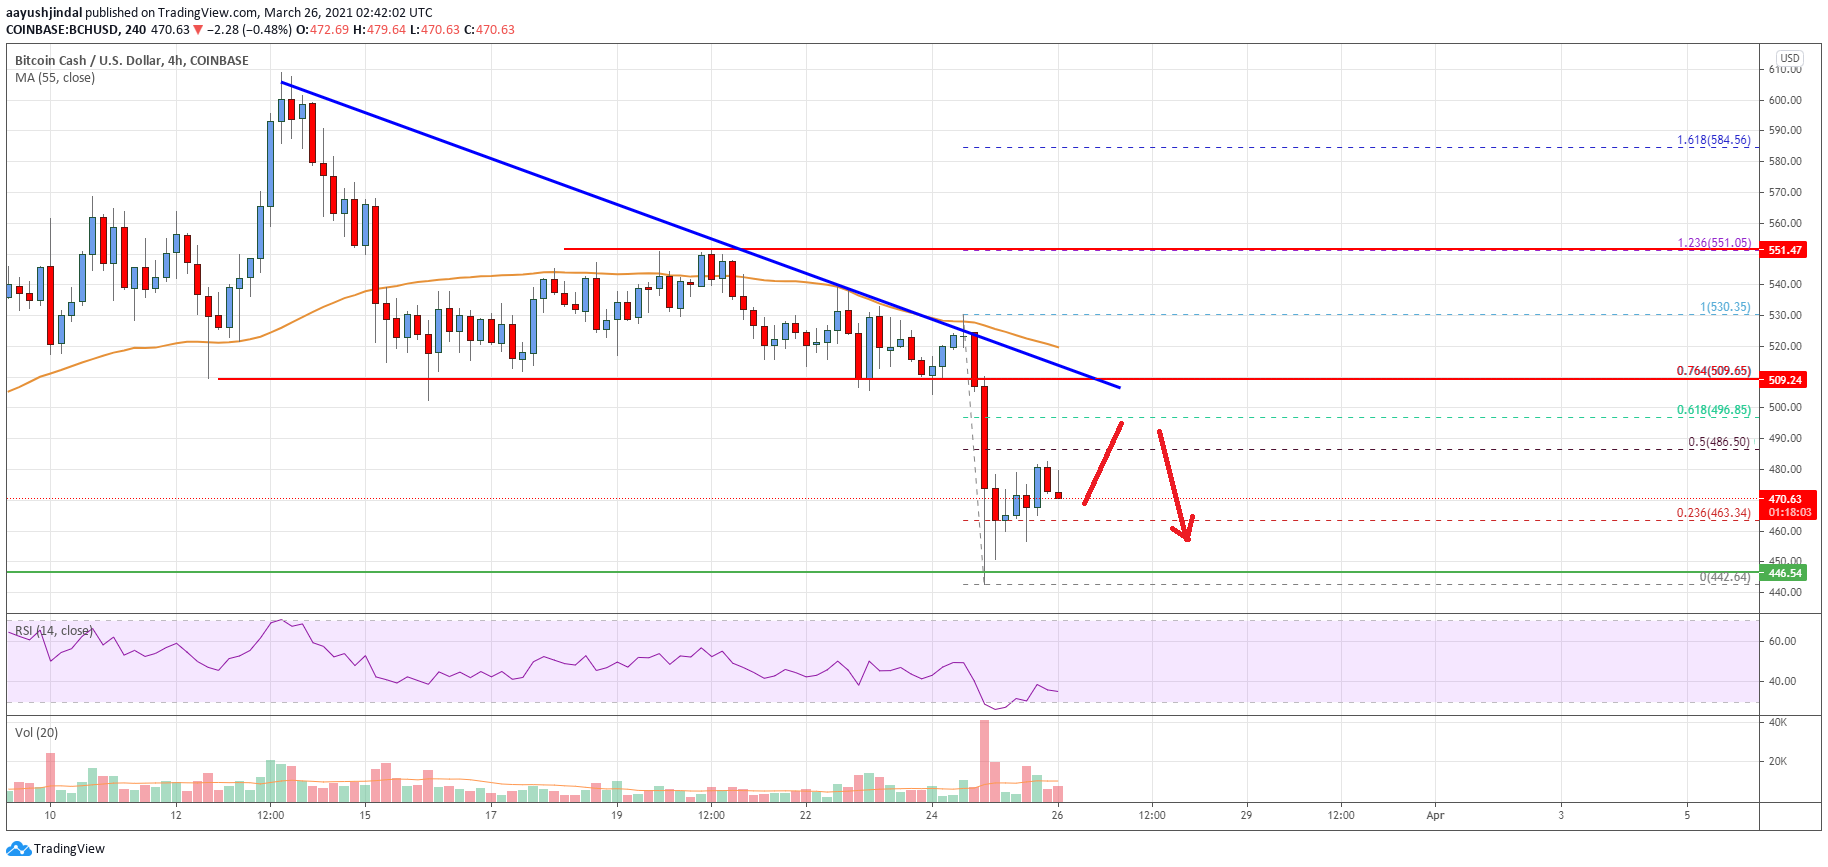
After a failed attempt to clear the $550 zone, bitcoin cash price started a fresh decline. BCH price broke the $510 and $500 support levels to move into a bearish zone.
There was a drop below the $480 support and the 55 simple moving average (4-hours). It traded as low as $442 and it is now consolidating losses. An initial resistance on the upside is near the $485 level. It is close to the 50% Fib retracement level of the downward move from the $530 high to $442 low.
There is also a major bearish trend line forming with resistance near $505 on the 4-hours chart of the BCH/USD pair. The trend line is close to the 76.4% Fib retracement level of the downward move from the $530 high to $442 low.
The 55 simple moving average (4-hours) is also near the $520 level. Clearly, there is a cluster of hurdles forming near the $500, $510 and $520 levels.
A successful break above the $510 and $520 levels is must for upside continuation. On the downside, the $460 level is a decent support. The main support is now forming near the $445 level. If there is a downside break below the $445 support, there is a risk of a drop towards the $420 and $410 levels.
Looking at the chart, bitcoin cash price is clearly trading well below the $500 level and the 55 simple moving average (4-hours). Overall, the price could correct higher, but upsides are likely to be capped near $500 and $510.
Technical indicators
4 hours MACD – The MACD for BCH/USD is now gaining pace in the bearish zone.
4 hours RSI (Relative Strength Index) – The RSI for BCH/USD is well below the 50 level.
Key Support Levels – $460 and $445.
Key Resistance Levels – $500 and $510.


Leave a Reply
You must be logged in to post a comment.