
- Bitcoin cash price is trading nicely above the $235 and $245 resistance levels against the US Dollar.
- The price traded to a new monthly high at $266 and it is well above the 55 simple moving average (4-hours).
- There is a major bullish trend line forming with support near $246 on the 4-hours chart of the BCH/USD pair (data feed from Coinbase).
- The pair is likely to resume its upward move as long as it is above the $245 support zone.
Bitcoin cash price started a strong increase and it even broke $260 against the US Dollar. BCH/USD is currently correcting lower, but dips remain supported near $245.
Bitcoin Cash Price Analysis
This week, bitcoin cash price started a steady increase above the $235 resistance against the US Dollar. BCH price broke a few important hurdles near $245 to move into a positive zone.
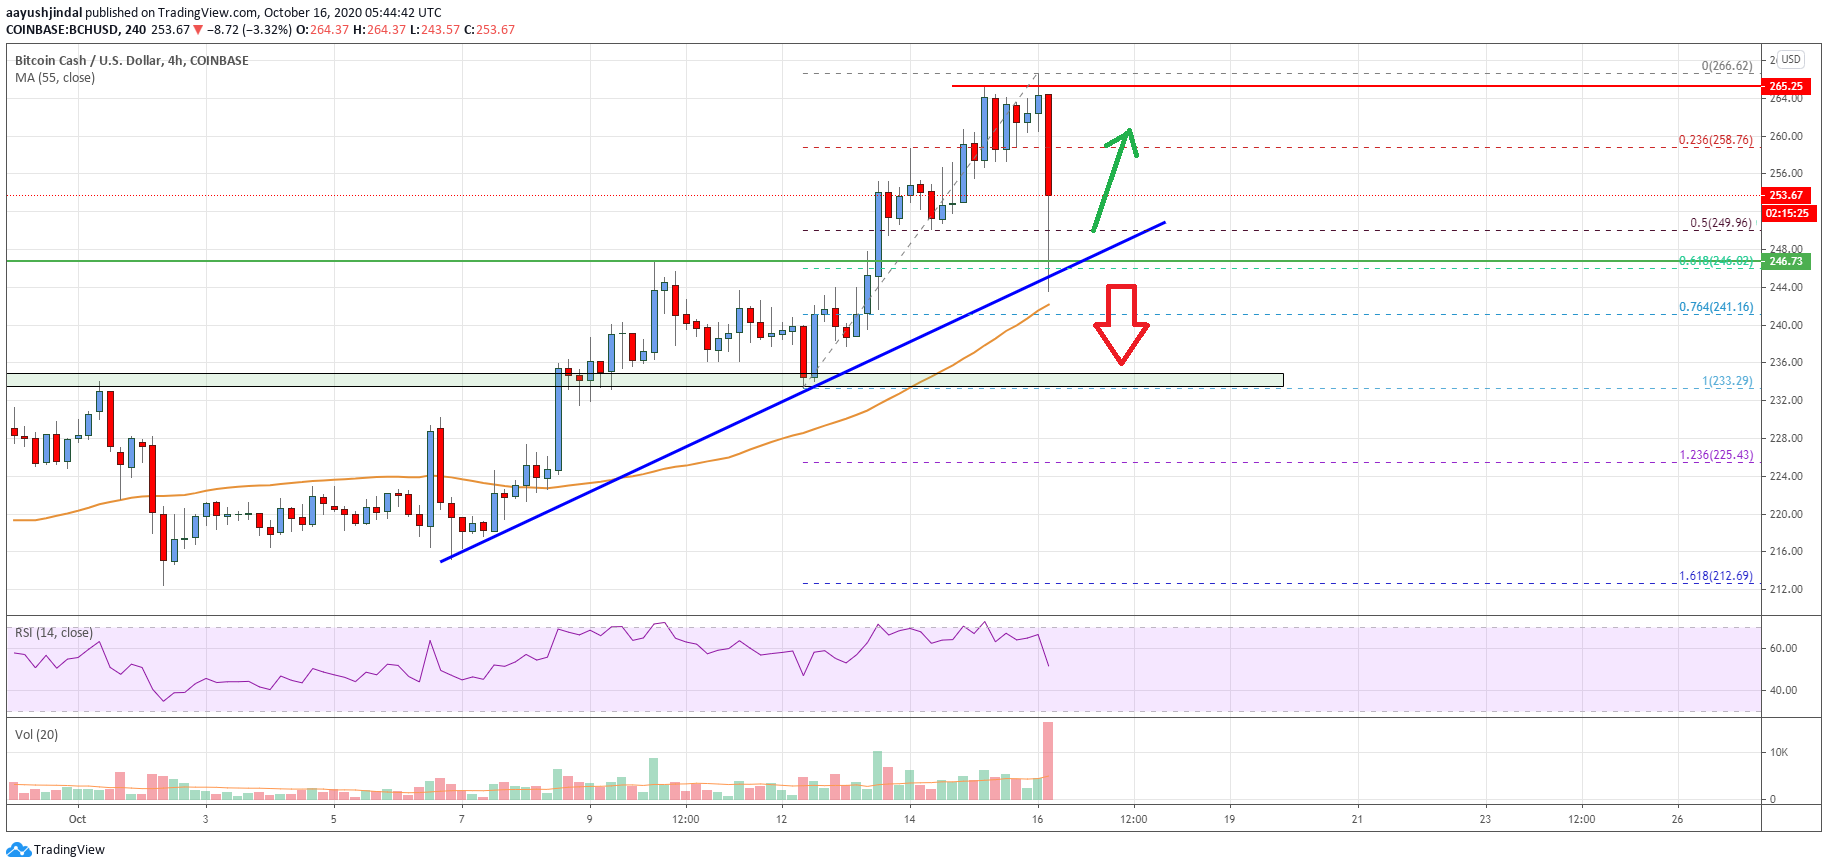
The bulls even pushed the price above the $250 resistance and BCH settled well above the 55 simple moving average (4-hours). Finally, it spiked above the $265 resistance and traded to a new monthly high at $266.
Recently, there was a sharp downside correction from the $266 high. The price broke the $255 support, plus traded below the 50 Fib retracement level of the recent upward move from the $233 swing low to $266 monthly high.
However, the bulls were able to protect the main $245 support level (the recent breakout zone). The 61.8% Fib retracement level of the recent upward move from the $233 swing low to $266 monthly high is also acting as a support.
More importantly, there is a major bullish trend line forming with support near $246 on the 4-hours chart of the BCH/USD pair. The pair is currently showing a lot of positive signs above the $245 level.
On the upside, the price is facing hurdles near the $258 level. The next major resistance is near the $265 level, above which the price might rise steadily towards the $275 and $278 levels.
On the downside, the first major support is near the $245 level. If there is a downside break below the trend line and $245, the price could test the main $234 support zone.
Looking at the chart, bitcoin cash price is clearing trading nicely above the $235 and $245 resistance levels. The price is likely to resume its upward move as long as it is above the $245 support zone in the near term.
Technical indicators
4 hours MACD – The MACD for BCH/USD is slowly losing momentum in the bullish zone.
4 hours RSI (Relative Strength Index) – The RSI for BCH/USD is correcting lower towards the 50 level.
Key Support Levels – $245 and $234.
Key Resistance Levels – $258 and $265.


Leave a Reply
You must be logged in to post a comment.