- Bitcoin cash price failed to clear the $310-311 resistance area and declined recently against the US Dollar.
- The price broke the $280 support level and traded close to the $257 support area.
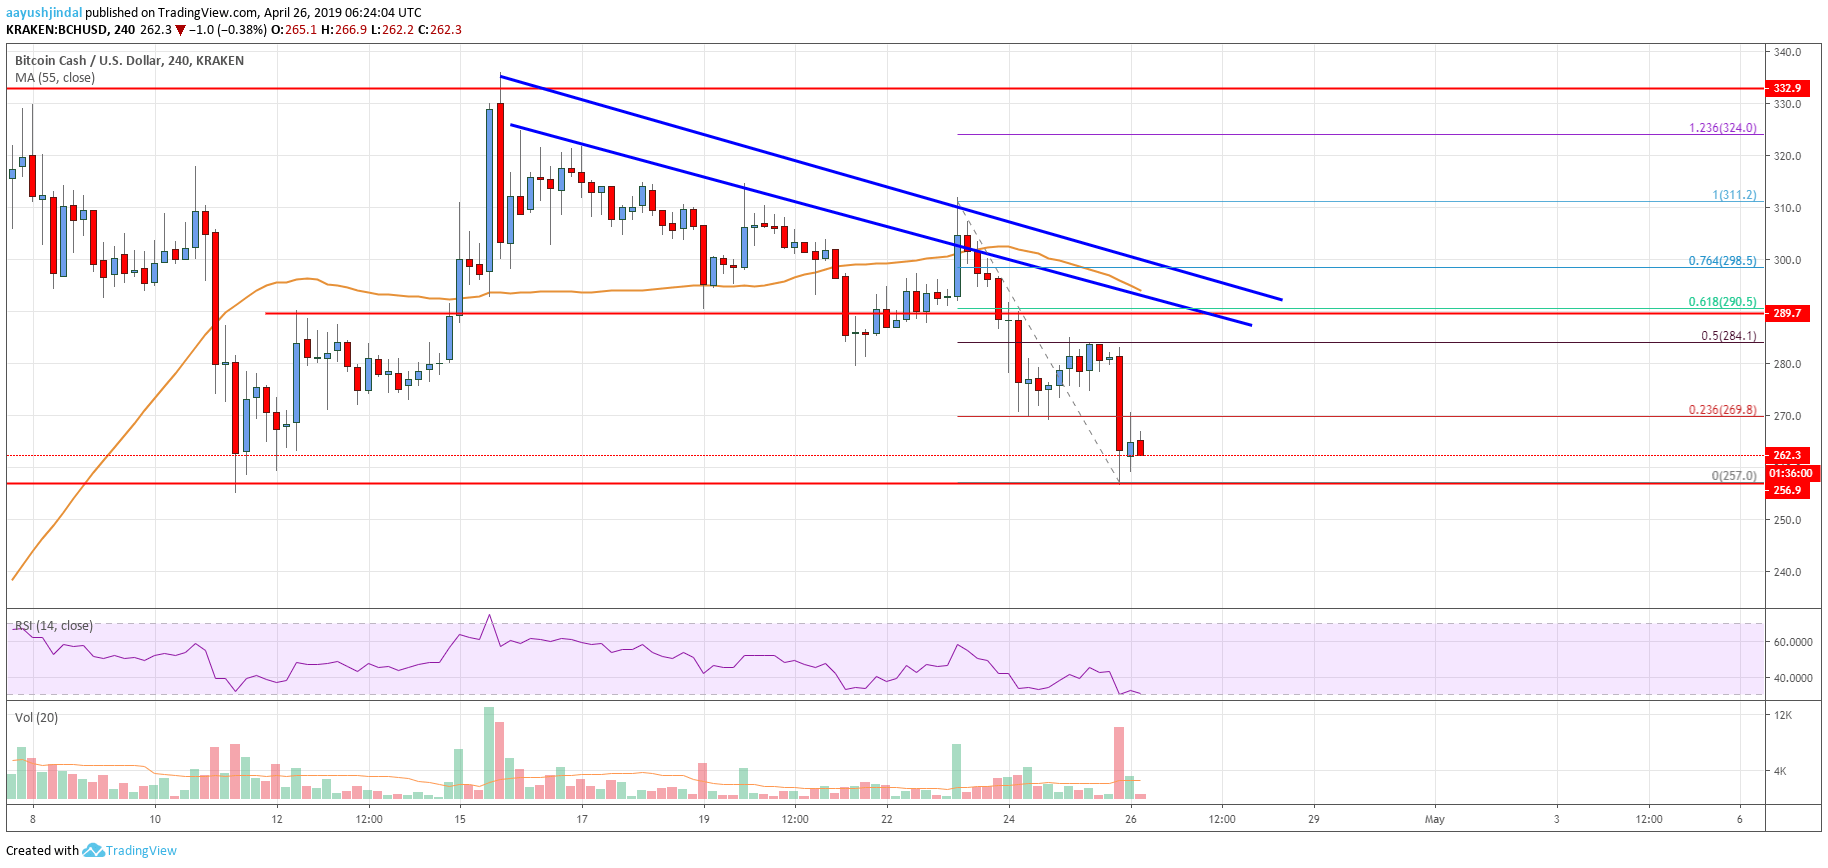
- There are two bearish trend lines in place with resistance near $290 on the 4-hours chart of the BCH/USD pair (data feed from Kraken).
- The pair remains at a risk of a sharp decline if there is a downside break below the $250 support.
Bitcoin cash price is currently under a lot of pressure below the $280 level against the US Dollar. BCH could tumble towards the $220 level if there is a break below $257 and $250.
Bitcoin Cash Price Analysis
There was a slow and steady decline started in bitcoin cash from the $332 swing high against the US Dollar. The BCH/USD pair traded below the $320 and $310 levels to move into a bearish zone. Later, the price made an attempt to climb above $310-311, but it failed. As a result, there was a sharp decline below $300 and the price settled below the 55 simple moving average (4-hours). The price broke the $285 and $280 support levels to move further into a bearish zone.
It tested the key $257 support level and currently consolidating losses. An immediate resistance is near $269 and the 23.6% Fib retracement level of the last decline from the $311 high to $257 low. The next key resistance is near the $285 level. It represents the 50% Fib retracement level of the last decline from the $311 high to $257 low. Besides, there are two bearish trend lines in place with resistance near $290 on the 4-hours chart of the BCH/USD pair.
The trend lines coincide with the 55 simple moving average (4-hours) plus the 61.8% Fib retracement level of the last decline from the $311 high to $257 low. Therefore, if there is an upside correction, the price could face a strong resistance near $285 or $290. A successful close above $295 and the 55 SMA is must for more upsides in the near term.

Looking at the chart, bitcoin cash price is clearly struggling below the $285 level. If there is a downside break below the $257 support, there could be a strong decline. Additionally, a break below the $250 support could kick start a major decline. The next key supports are near $220 and $210.
Technical indicators
4 hours MACD – The MACD for BCH/USD is currently placed heavily in the bearish zone.
4 hours RSI (Relative Strength Index) – The RSI for BCH/USD is now well below the 40 level, with a bearish angle.
Key Support Levels – $257 and $250.
Key Resistance Levels – $285 and $290.


Leave a Reply
You must be logged in to post a comment.