- Bitcoin cash price declined recently, but it found support near the $115 level against the US Dollar.
- There is a significant bearish trend line formed with resistance at $132 on the 4-hours chart of the BCH/USD pair (data feed from Kraken).
- The pair could gain bullish momentum if it breaks the $132 and $136 resistance levels in the near term.
Bitcoin cash price is setting up for the next crucial break against the US Dollar. BCH is likely to accelerate higher if buyers succeed in pushing the price above $132, $135 and $136.
Bitcoin Cash Price Analysis
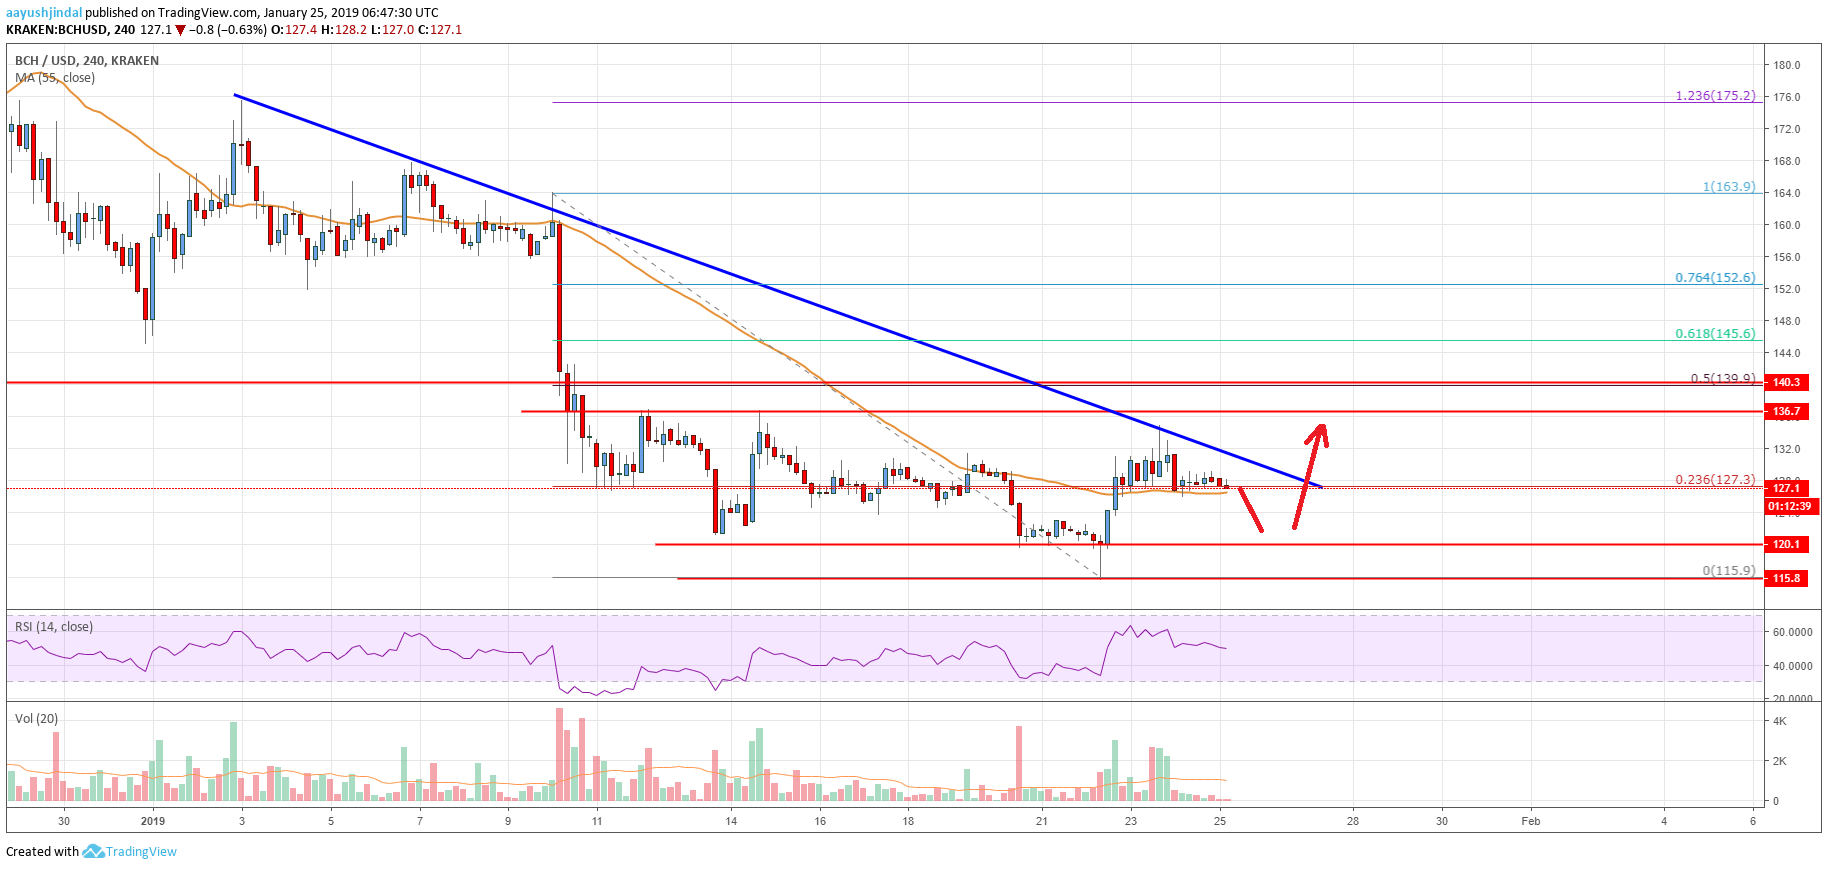
This week, there were few bearish moves in bitcoin and Ethereum, which pushed bitcoin cash price below $130 against the US Dollar. The BCH/USD pair even broke the $120 support level and tested the $115 level. A low was formed near $116 and later the price bounced back above $120. Buyers even pushed the price above the $125 level and the 55 simple moving average (4-hours). Besides, there was a break above the 23.6% Fib retracement level of the last drop from the $163 high to $116 swing low.
However, the upward move was capped by the $135-136 resistance zone. Later, the price trimmed gains and traded below the $132 level. At the moment, the price is consolidating below the $132, $135 and $136 resistance levels. More importantly, there is a significant bearish trend line formed with resistance at $132 on the 4-hours chart of the BCH/USD pair. Above the trend line and $136, the price could test the key $140 barrier. It coincides with the 50% Fib retracement level of the last drop from the $163 high to $116 swing low.

Looking at the chart, bitcoin cash price is showing positive signs above the $120 support. Having said that, buyers need to gain momentum above $132 to push the price into a bullish zone. If they fail, there is a risk of a downside break below $120 and $115.
Technical indicators
4-hours MACD – The MACD for BCH/USD is slightly placed in the bearish zone.
4-hours RSI (Relative Strength Index) – The RSI for BCH/USD is struggling to stay above the 50 level.
Key Support Level – $120
Key Resistance Level – $132


Leave a Reply
You must be logged in to post a comment.