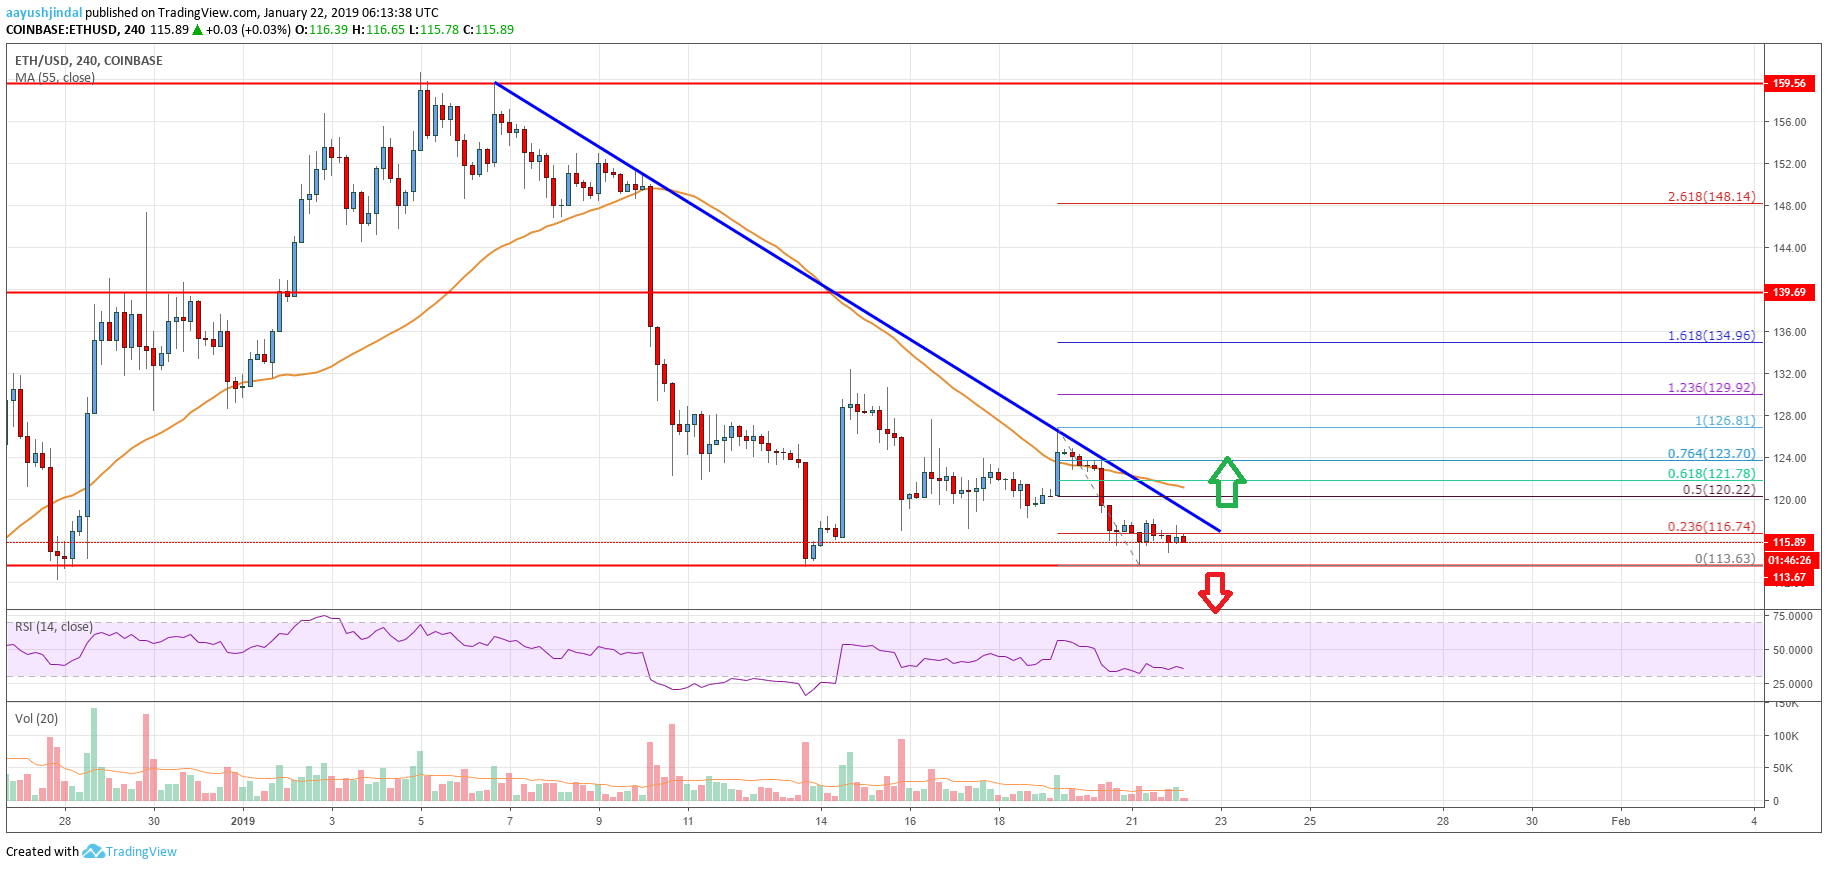
- Ethereum price declined recently and revisited the key $113 and $114 supports against the US Dollar.
- ETH is trading below a crucial bearish trend line with resistance at $120 on the 4-hours chart (data feed from Coinbase).
- The price will most likely make the next significant move either above $120 or below $113 in the near term.
Ethereum price is under a lot of pressure below the $120 pivot level against the US Dollar. ETH is preparing for the next break either above $120 or towards $100 in the coming sessions.
Ethereum Price Analysis
In the past few days, there were mostly bearish moves below $135 in Ethereum price against the US Dollar. The ETH/USD pair declined from the $160 swing high and settled below the $140 and $138 support levels. It traded towards the $113 and $114 support levels and later recovered a few points. The price climbed above the $120 and $125 levels, but it struggled to gain traction above $130-132. As a result, there was a fresh decline and a few swing highs were formed near $128 and $126. The last swing high was near $126 before the price retested the $113 support area.
It is currently trading a few points above the $113 support. An immediate resistance is the 23.6% Fib retracement level of the recent drop from the $127 swing high to $113 swing low. More importantly, there is a crucial bearish trend line in place with resistance at $120 on the 4-hours chart. Above the trend line, the 50% Fib retracement level of the recent drop from the $127 swing high to $113 swing low is near $120. Finally, the 55 simple moving average (4-hours) is positioned near the $121 level. Therefore, a break above the $120-121 resistance zone is must for a fresh recovery.

Looking at the chart, Ethereum price seems to be preparing for the next significant move either above $120 or below $113. Above $120-121, the price may test $130, and below $113, the price could test $100.
Technical indicators
4-hours MACD – The MACD for ETH/USD is placed heavily in the bearish zone.
4-hours RSI (Relative Strength Index) – The RSI for ETH/USD is currently well below the 35 level.
Key Support Level – $113
Key Resistance Level – $121


Leave a Reply
You must be logged in to post a comment.