- Bitcoin cash price extended losses this week and tested the $230 support area against the US Dollar.
- The price bounced back recently and cleared the $248 and $256 resistance levels.
- There is a major bearish trend line in place with resistance near $273 on the 4-hours chart of the BCH/USD pair (data feed from Kraken).
- The pair is likely to start a fresh rally once it clears the $273 and $275 resistance levels in the near term.
Bitcoin cash price is placed nicely above the $256 support against the US Dollar. BCH is likely to surge higher towards $300 or $310 as long as it is above $256.
Bitcoin Cash Price Analysis
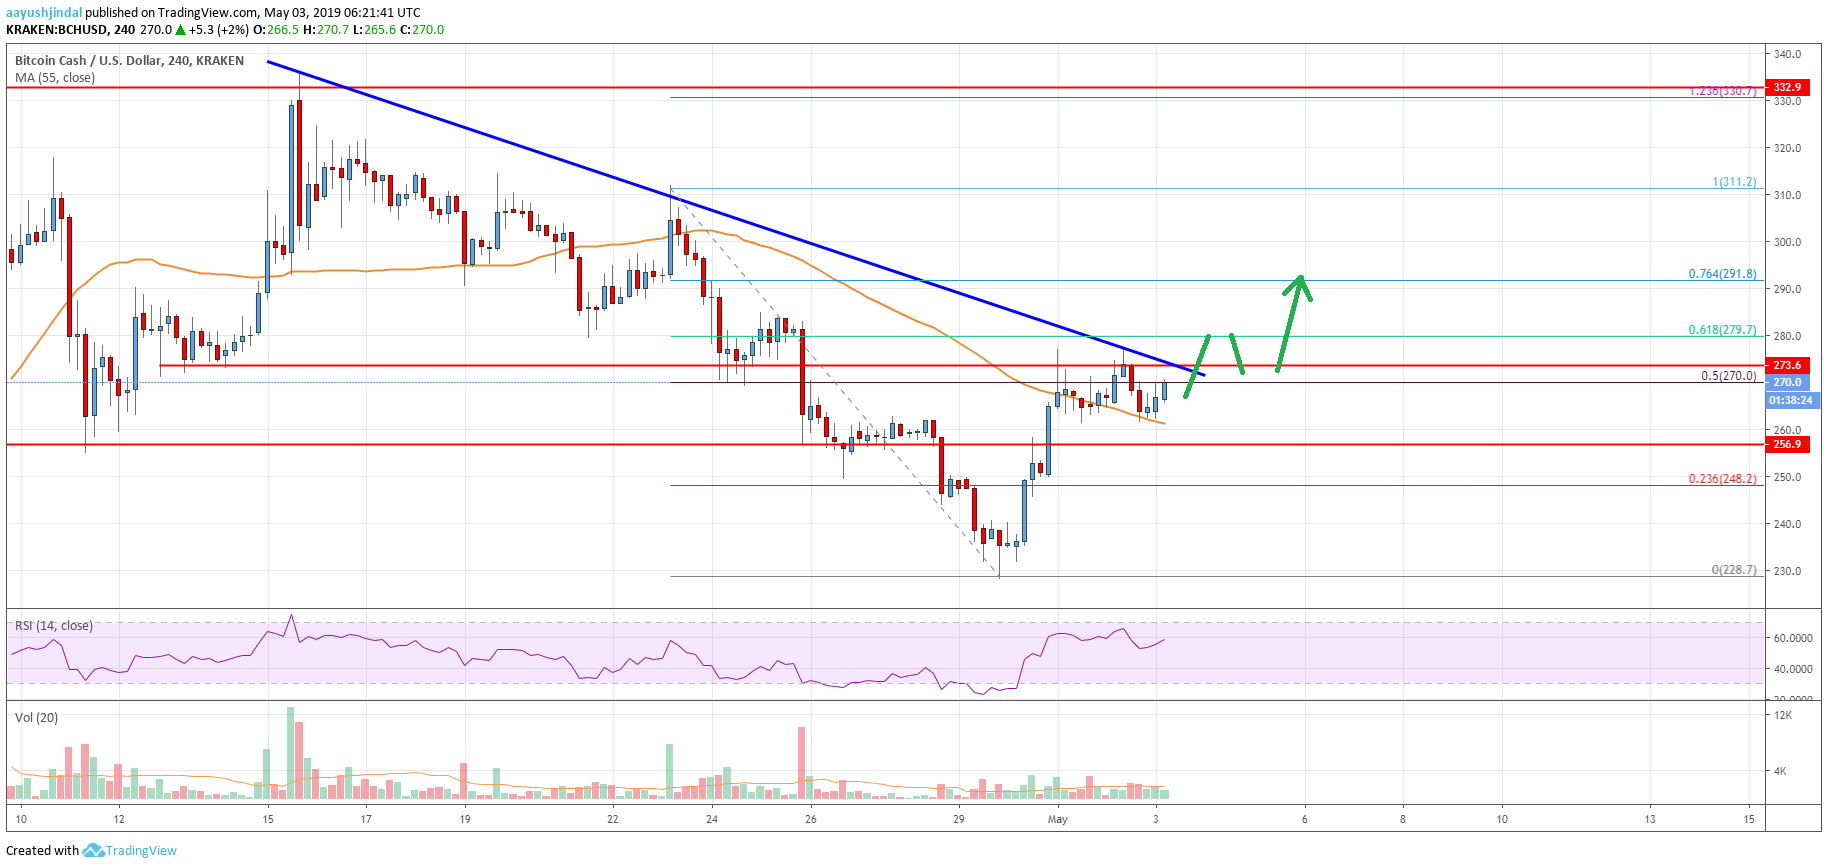
There was a downside extension in bitcoin cash below the $260 and $256 support levels against the US Dollar. The BCH/USD pair even broke the $240 support and settled below the 55 simple moving average (4-hours). Finally, there was a spike below the $230 support and the price formed a swing low at $228. Recently, it started a fresh increase, following bitcoin price rise. BCH broke the $235, $240 and $256 resistance levels to move into a positive zone.
There was a close above the $260 level and the 55 simple moving average (4-hours). The price even spiked above $265, and the 50% Fib retracement level of the last decline from the $311 high to $228 low. However, there is a strong resistance formed near the $272 and $273 levels. There is also a major bearish trend line in place with resistance near $273 on the 4-hours chart of the BCH/USD pair. Above the trend line, the 61.8% Fib retracement level of the last decline from the $311 high to $228 low is at $279.
Therefore, a close above the trend line and $279 may start a strong rally in the near term. The next key resistance is near the $291 level, above which the price could test the $300 level. In the best case, the price could even test the $311 swing high in the near term.

Looking at the chart, bitcoin cash price is clearly trading near a major hurdle at $273. There could be a couple of swing moves, but the price is likely to accelerate higher above $280 in the near term. If there is a downside correction, the price may find strong bids near the $260 and $256 support levels.
Technical indicators
4 hours MACD – The MACD for BCH/USD is slowly gaining pace in the bullish zone.
4 hours RSI (Relative Strength Index) – The RSI for BCH/USD is now well above the 50 level, with a bullish angle.
Key Support Levels – $260 and $256.
Key Resistance Levels – $273 and $279.


Leave a Reply
You must be logged in to post a comment.