- Bitcoin cash price corrected higher, but it struggled to break the $120 resistance against the US Dollar.
- There is a significant bearish trend line formed with resistance at $115 on the 4-hours chart of the BCH/USD pair (data feed from Kraken).
- The pair could rally if buyers manage to push the price above the $115 and $120 resistance levels.
Bitcoin cash price made a couple attempts to clear the $120 resistance against the US Dollar. BCH failed to gain momentum and it is currently preparing for the next break.
Bitcoin Cash Price Analysis
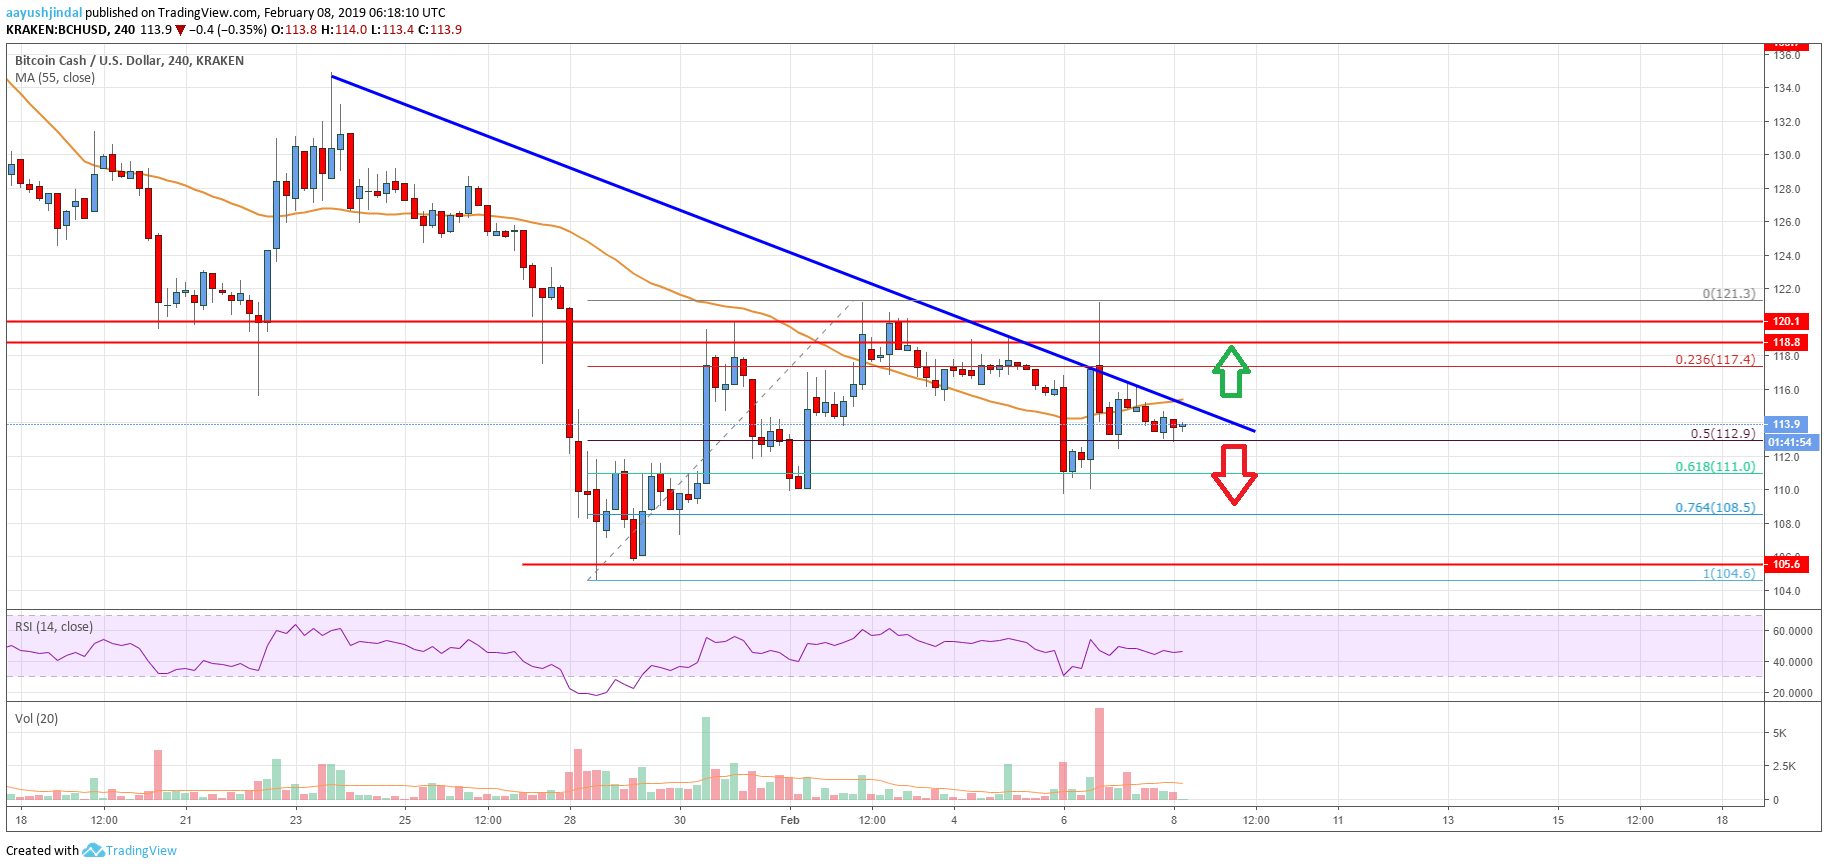
This week, there were further slides in bitcoin, ripple, Ethereum, and bitcoin cash against the US Dollar. Earlier, the BCH/USD pair corrected higher and broke the $115 resistance level. However, the pair failed to gain pace above the $120 resistance. A rejection pattern was formed near $120 and the price declined below the 55 simple moving average (4-hours). The price traded lower below the 50% Fib retracement level of the last wave from the $104 low to $121 swing high. The decline was such that the price tested the $110 support.
It seems like 61.8% Fib retracement level of the last wave from the $104 low to $121 swing high protected losses. The pair jumped higher, but once again the $120 resistance acted as a resistance. More importantly, there is a significant bearish trend line formed with resistance at $115 on the 4-hours chart of the BCH/USD pair. A successful close above the trend line, $120, and the 55 SMA is needed for a decent rebound. The next resistance is near the $126 level, above which the price could trade towards $134. If there is no upside break above $120, the price could decline towards the $110 or $105 support levels.

Looking at the chart, bitcoin cash price is likely preparing for the next break either above $120 or below $110. Having said that, a successful daily close above $120 is must for a sustained upward move.
Technical indicators
4-hours MACD – The MACD for BCH/USD is placed slightly in the bearish zone.
4-hours RSI (Relative Strength Index) – The RSI for BCH/USD is currently flat near the 45 level.
Key Support Level – $110
Key Resistance Level – $120


Leave a Reply
You must be logged in to post a comment.