- Bitcoin price recovered a few points, but it failed near $3,475 and declined heavily against the US Dollar.
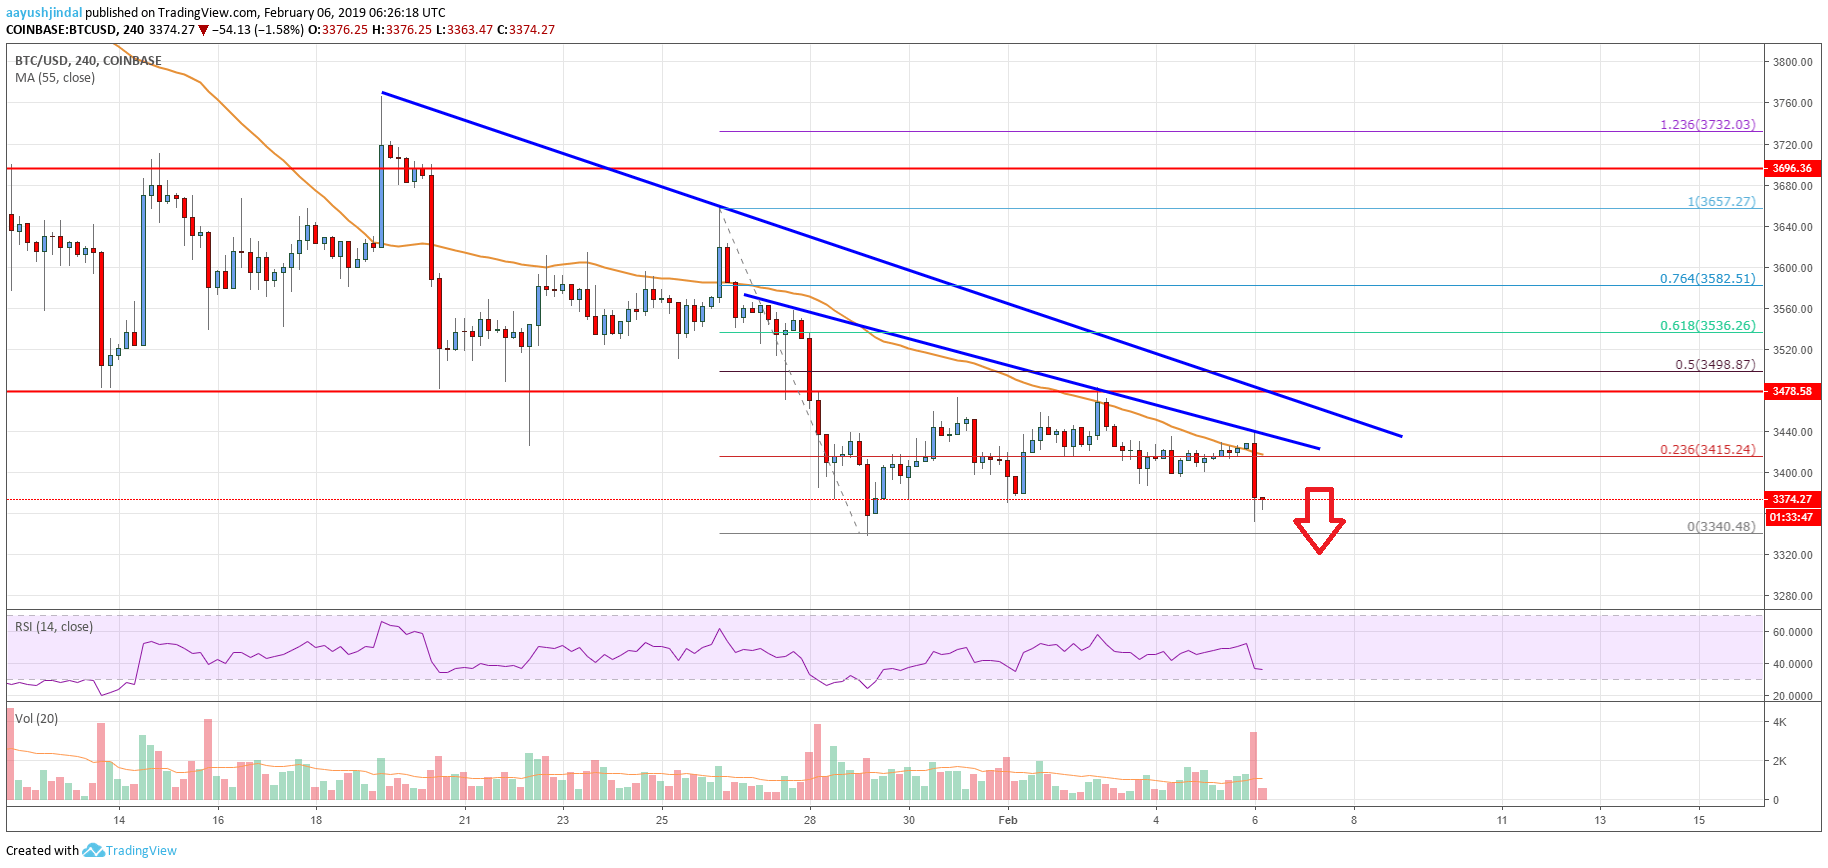
- There are two key bearish trend lines formed with resistance near $3,430 and $3,445 on the 4-hours chart of the BTC/USD pair (data feed from Coinbase).
- The price is trading in a downtrend and it could soon decline towards the $3,000 handle in the near term.
Bitcoin price traded with a bearish tone below $3,500 against the US Dollar. BTC broke the $3,400 support recently, opening the doors for a test of $3,200 or $3,000.
Bitcoin Price Analysis
After trading as low as $3,340, bitcoin price started a short term correction against the US Dollar. The BTC/USD pair traded above the $3,400 and $3,450 resistance levels. Besides, there was a break above the 23.6% Fib retracement level of the last major decline from the $3,657 high to $3,340 low. However, the upside move was capped by the $3,475-3,480 resistance area. More importantly, buyers failed to gain strength above $3,475 and the 55 simple moving average (4-hours).
As a result, there was a rejection pattern formed near $3,475. The price started a fresh decline and moved below the $3,400 support level. However, there was no test of the last low at $3,340. The price action is clearly bearish below $3,400 and $3,420. If there is a break below the $3,340 swing low, the price may perhaps decline towards the $3,200 or $3,000 support. On the other hand, there are many resistances near the $3,400 and $3,440 levels. There are also two key bearish trend lines formed with resistance near $3,430 and $3,445 on the 4-hours chart of the BTC/USD pair. Below the trend line, the 55 simple moving average (4-hours) is placed at $3,415.

Looking at the chart, bitcoin price is about to decline below the $3,340 support. If there is an upside correction, sellers are likely to appear near $3,400 or $3,415.
Technical indicators
4-hour MACD – The MACD is showing a lot of bearish signs in the bearish zone.
4-hour RSI (Relative Strength Index) – The RSI is currently placed well below the 50 level.
Key Support Level – $3,340
Key Resistance Level – $3,415


Leave a Reply
You must be logged in to post a comment.