- Ethereum price remained below the key $109 and $114 resistance levels against the US Dollar.
- ETH is testing a crucial bearish trend line with resistance at $106 on the 4-hours chart (data feed from Coinbase).
- The price is likely setting up for the next move either above $109 or below $100 in the near term.
Ethereum price struggling below important resistances at $109 and $114 against the US Dollar. ETH could tumble if it continues to struggle below the $109 resistance area.
Ethereum Price Analysis
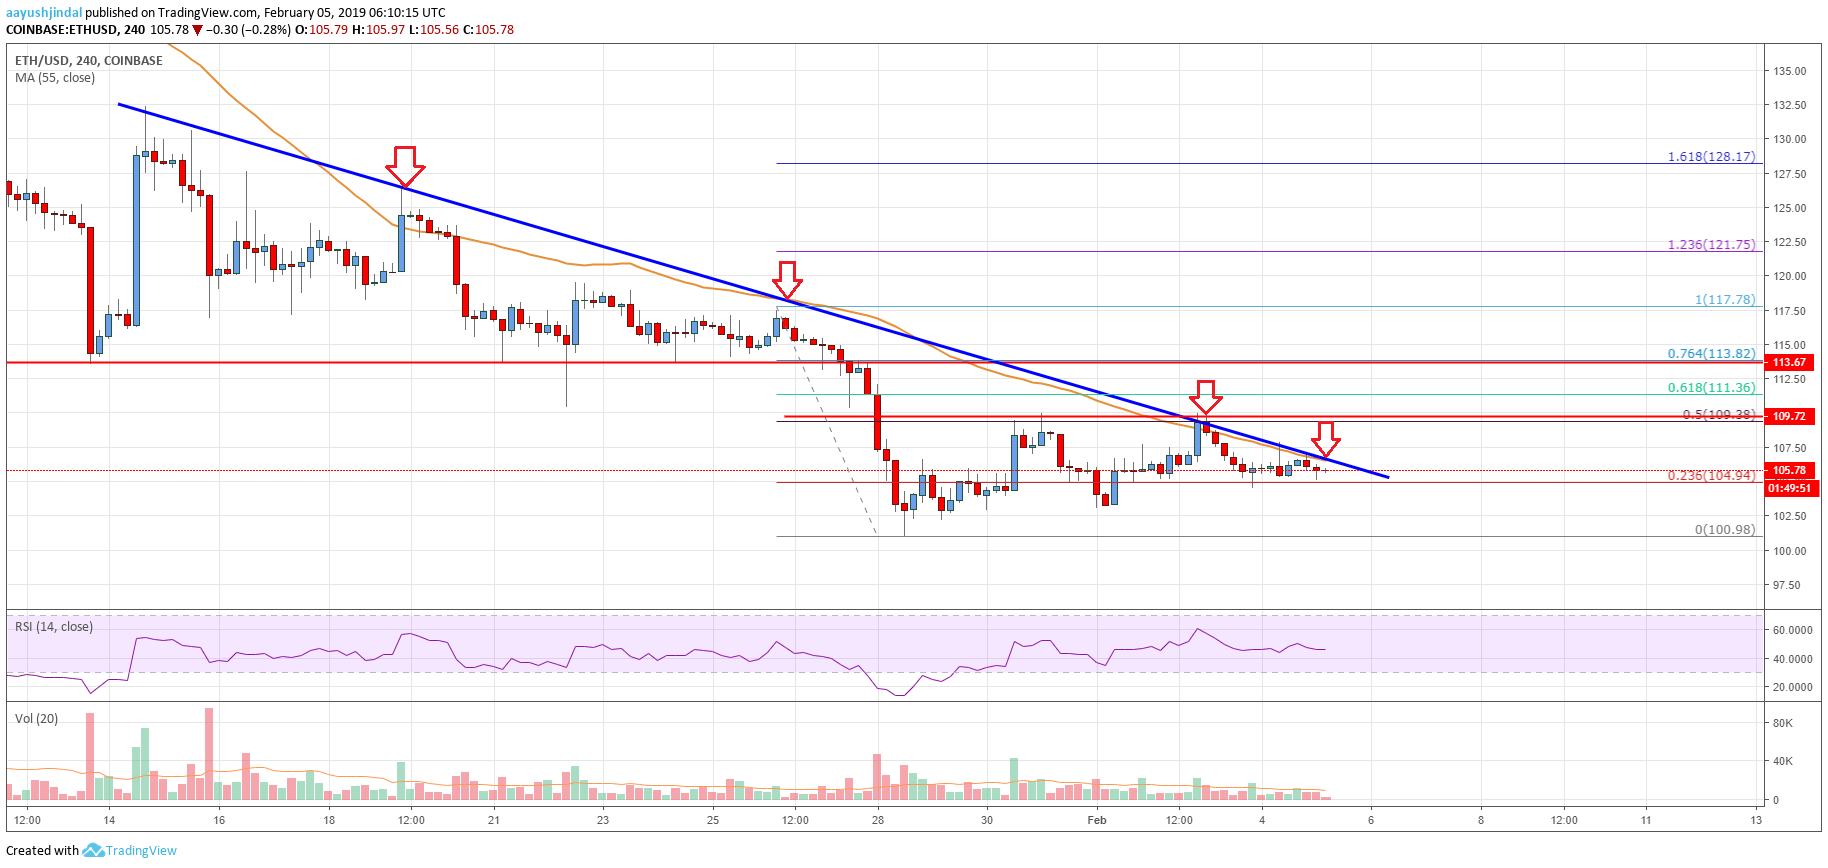
After trading towards the $100 support, Ethereum price started a short term correction against the US Dollar. The ETH/USD pair recovered above the $105 and $107 resistance levels. There was also a break above the 23.6% Fib retracement level of the key decline from the $118 high to $101 low. However, the price faced a strong resistance near the $109-110 zone. Besides, the 55 simple moving average (4-hours), which is currently at $106 also acted as a strong resistance.
The price topped near the 50% Fib retracement level of the key decline from the $118 high to $101 low. More importantly, there is a crucial bearish trend line in place with resistance at $106 on the 4-hours chart of ETH/USD. Therefore, a successful break above the trend line and $109 is needed for a decent recovery. The next important resistance is near the $114 level. An intermediate resistance is near $111 and the 61.8% Fib retracement level of the key decline from the $118 high to $101 low. On the other hand, if there is no upside break, the price might decline below $104 and $102.

Looking at the chart, Ethereum price is struggling to break the trend line and the 55 simple moving average (4-hours). If it breaks the $102 support, there is a risk of a sharp drop below the $100 handle. The next major support for buyers is near the $90-92 zone.
Technical indicators
4-hours MACD – The MACD for ETH/USD is slightly placed in the bearish zone.
4-hours RSI (Relative Strength Index) – The RSI for ETH/USD is just below the 50 level, with a bearish angle.
Key Support Level – $101
Key Resistance Level – $109


Leave a Reply
You must be logged in to post a comment.