- Bitcoin price started a fresh increase from the $30,000 support zone against the US Dollar.
- The price is now trading above the $35,000 zone and the 55 simple moving average (4-hours).
- There was a break above a major bearish trend line with resistance near $35,000 on the 4-hours chart of the BTC/USD pair (data feed from Coinbase).
- The pair is correcting gains, but it is likely to remain stable above $35,000 and $34,000 in the near term.
Bitcoin price is recovering higher above $35,000 against the US Dollar. BTC must surpass $36,500 and $37,000 for more upsides in the near term.
Bitcoin Price Analysis
Bitcoin price remained well bid above the $30,000 and $32,000 levels. BTC started a fresh increase above the $34,000 zone to move into a positive zone.
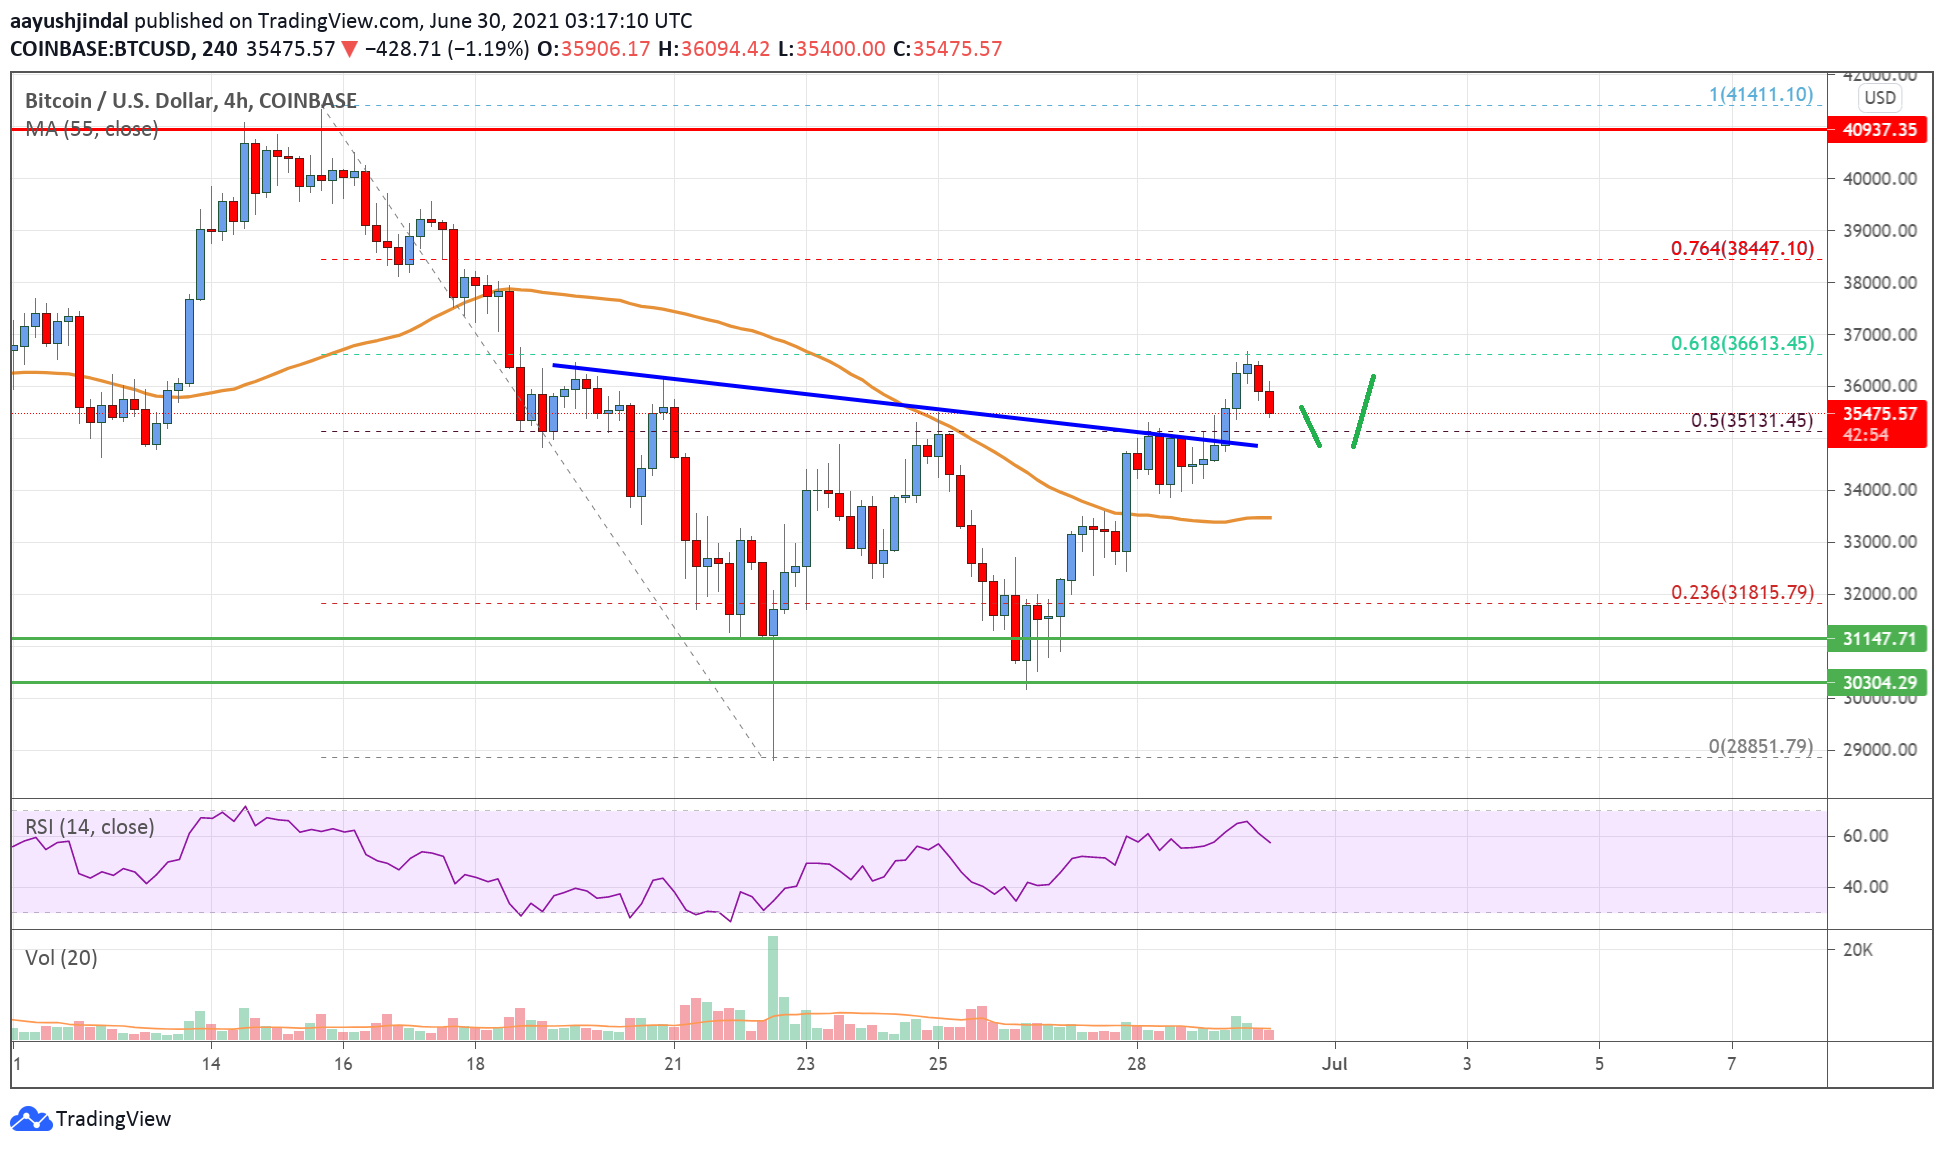
There was a clear break above the 50% Fib retracement level of the main decline from the $41,400 swing high to $28,850 swing low. There was also a break above a major bearish trend line with resistance near $35,000 on the 4-hours chart of the BTC/USD pair.
The pair now trading above the $35,000 zone and the 55 simple moving average (4-hours). It tested the 61.8% Fib retracement level of the main decline from the $41,400 swing high to $28,850 swing low.
It is now correcting gains and it is trading below $36,000. An initial support is near the broken trend line and $35,100. The main support is now forming near $34,000, below which there is a risk of a sharp decline in the coming sessions.
The 55 simple moving average (4-hours) is also near the $34,000 zone to act as a strong support. On the upside, an initial resistance is near the $36,600 level. The next major resistance is near the $37,000 zone.
A clear upside break above $37,000 could lead the price towards the $38,000 zone. Any more gains could set the pace for a test of the all-important barrier near the $40,000 level.
Looking at the chart, bitcoin price is clearly trading well above $35,000 and the 55 simple moving average (4-hours). Overall, the price is correcting gains, but it is likely to remain stable above $35,000 and $34,000 in the near term.
Technical indicators
4 hours MACD – The MACD is slowly gaining momentum in the bullish zone.
4 hours RSI (Relative Strength Index) – The RSI is now above the 50 level.
Key Support Levels – $35,000 and $34,000.
Key Resistance Levels – $36,500, $37,000 and $38,000.
