- Bitcoin price started a fresh increase above the $38,000 resistance against the US Dollar.
- The price is now trading above the $38,000 zone and the 55 simple moving average (4-hours).
- There was a break above a major bearish trend line with resistance near $38,000 on the 4-hours chart of the BTC/USD pair (data feed from Coinbase).
- The pair could correct lower, but it is likely to remain well bid near $38,500 and $38,000.
Bitcoin price is trading in a bullish zone above $38,000 against the US Dollar. BTC must surpass $41,500 and $42,000 for more upsides in the near term.
Bitcoin Price Analysis
Bitcoin price formed a base above the $35,000 level and it recently started a fresh increase. BTC broke the $36,500 resistance level to move into a positive zone.
There was a clear break above the $38,500 resistance and the 55 simple moving average (4-hours). There was also a break above a major bearish trend line with resistance near $38,000 on the 4-hours chart of the BTC/USD pair.
The pair even spiked above the $40,000 resistance zone. It traded as high as $41,393 and it is now consolidating gains. The pair corrected lower below the $40,500 level. It is now testing the 23.6% Fib retracement level of the upward move from the $34,678 low to $41,393 high.
The main support is now forming near the $38,000 level. It is close to the 50% Fib retracement level of the upward move from the $34,678 low to $41,393 high.
A downside break below $38,000 could open the doors for a move towards the $37,000 level and the 55 simple moving average (4-hours). On the upside, the price is facing resistance near the $41,000 level. The next key resistance is near the $42,000 level.
A clear break above the $42,000 level could open the doors for more upsides. The next major resistance is near the $45,000 level.
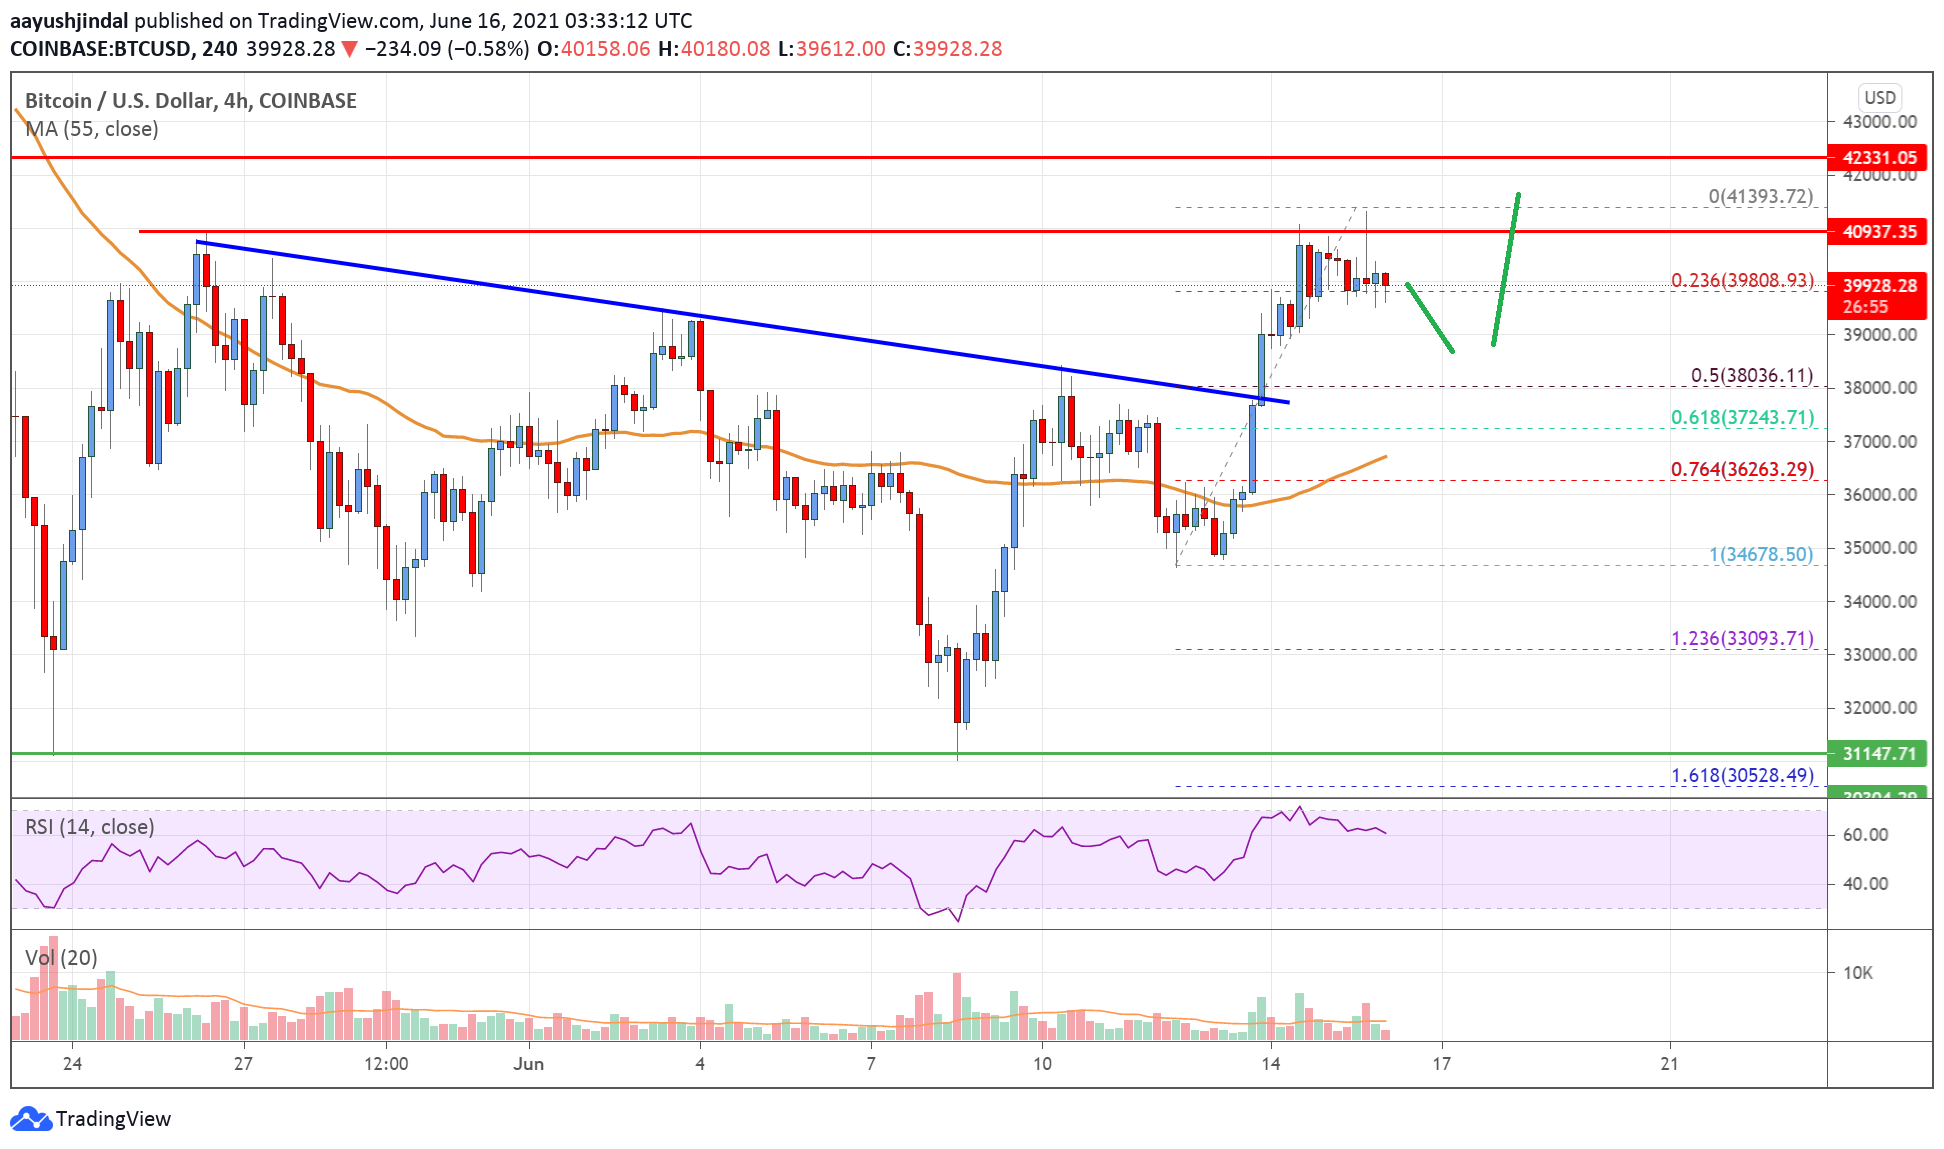
Looking at the chart, bitcoin price is clearly trading well above $38,000 and the 55 simple moving average (4-hours). Overall, the price could correct lower, but it is likely to remain well bid near $38,500 and $38,000.
Technical indicators
4 hours MACD – The MACD is slowly losing momentum in the bullish zone.
4 hours RSI (Relative Strength Index) – The RSI is now well above the 50 level.
Key Support Levels – $38,500 and $38,000.
Key Resistance Levels – $41,000, $42,000 and $45,000.
