
- Bitcoin price started trading in a range above the $34,000 zone against the US Dollar.
- The price is now trading below the $37,000 zone and the 55 simple moving average (4-hours).
- There is a major contracting triangle forming with resistance near $37,000 on the 4-hours chart of the BTC/USD pair (data feed from Coinbase).
- The pair is likely to start a major increase if there is a clear break above $39,000 and $40,000.
Bitcoin price is attempting an upside break above $39,000 against the US Dollar. BTC must surpass $39,000 and $40,000 to start a strong upward move.
Bitcoin Price Analysis
Bitcoin price formed a base above the $32,000 and $33,200 levels. BTC started a decent upward move and it broke the $35,000 resistance zone. There was also a spike above the $38,000 level and the 55 simple moving average (4-hours).
However, the price failed to gain pace above the $40,000 level. The last swing high was formed near $40,900 and the price corrected lower. It traded as low as $33,182 and it is now consolidating.
There was a break above the $35,000 level. The price is still trading below the $37,000 zone and the 55 simple moving average (4-hours). It broke the 23.6% Fib retracement level of the recent decline from the $40,900 swing high to $33,182 low.
It seems like the price is struggling to clear the $37,000 zone. It is near the 50% Fib retracement level of the recent decline from the $40,900 swing high to $33,182 low.
The main resistance is near the $39,000 level. There is also a major contracting triangle forming with resistance near $37,000 on the 4-hours chart of the BTC/USD pair. If there is an upside break above the $39,000 resistance and the 55 simple moving average (4-hours), the price could even surpass $40,000. The next key resistance could be $45,000.
On the downside, the $35,000 level is a decent support. The main support is now forming near the $34,500 level and the triangle lower trend line. If there is a downside break below the $34,500 support, the price could resume its decline.
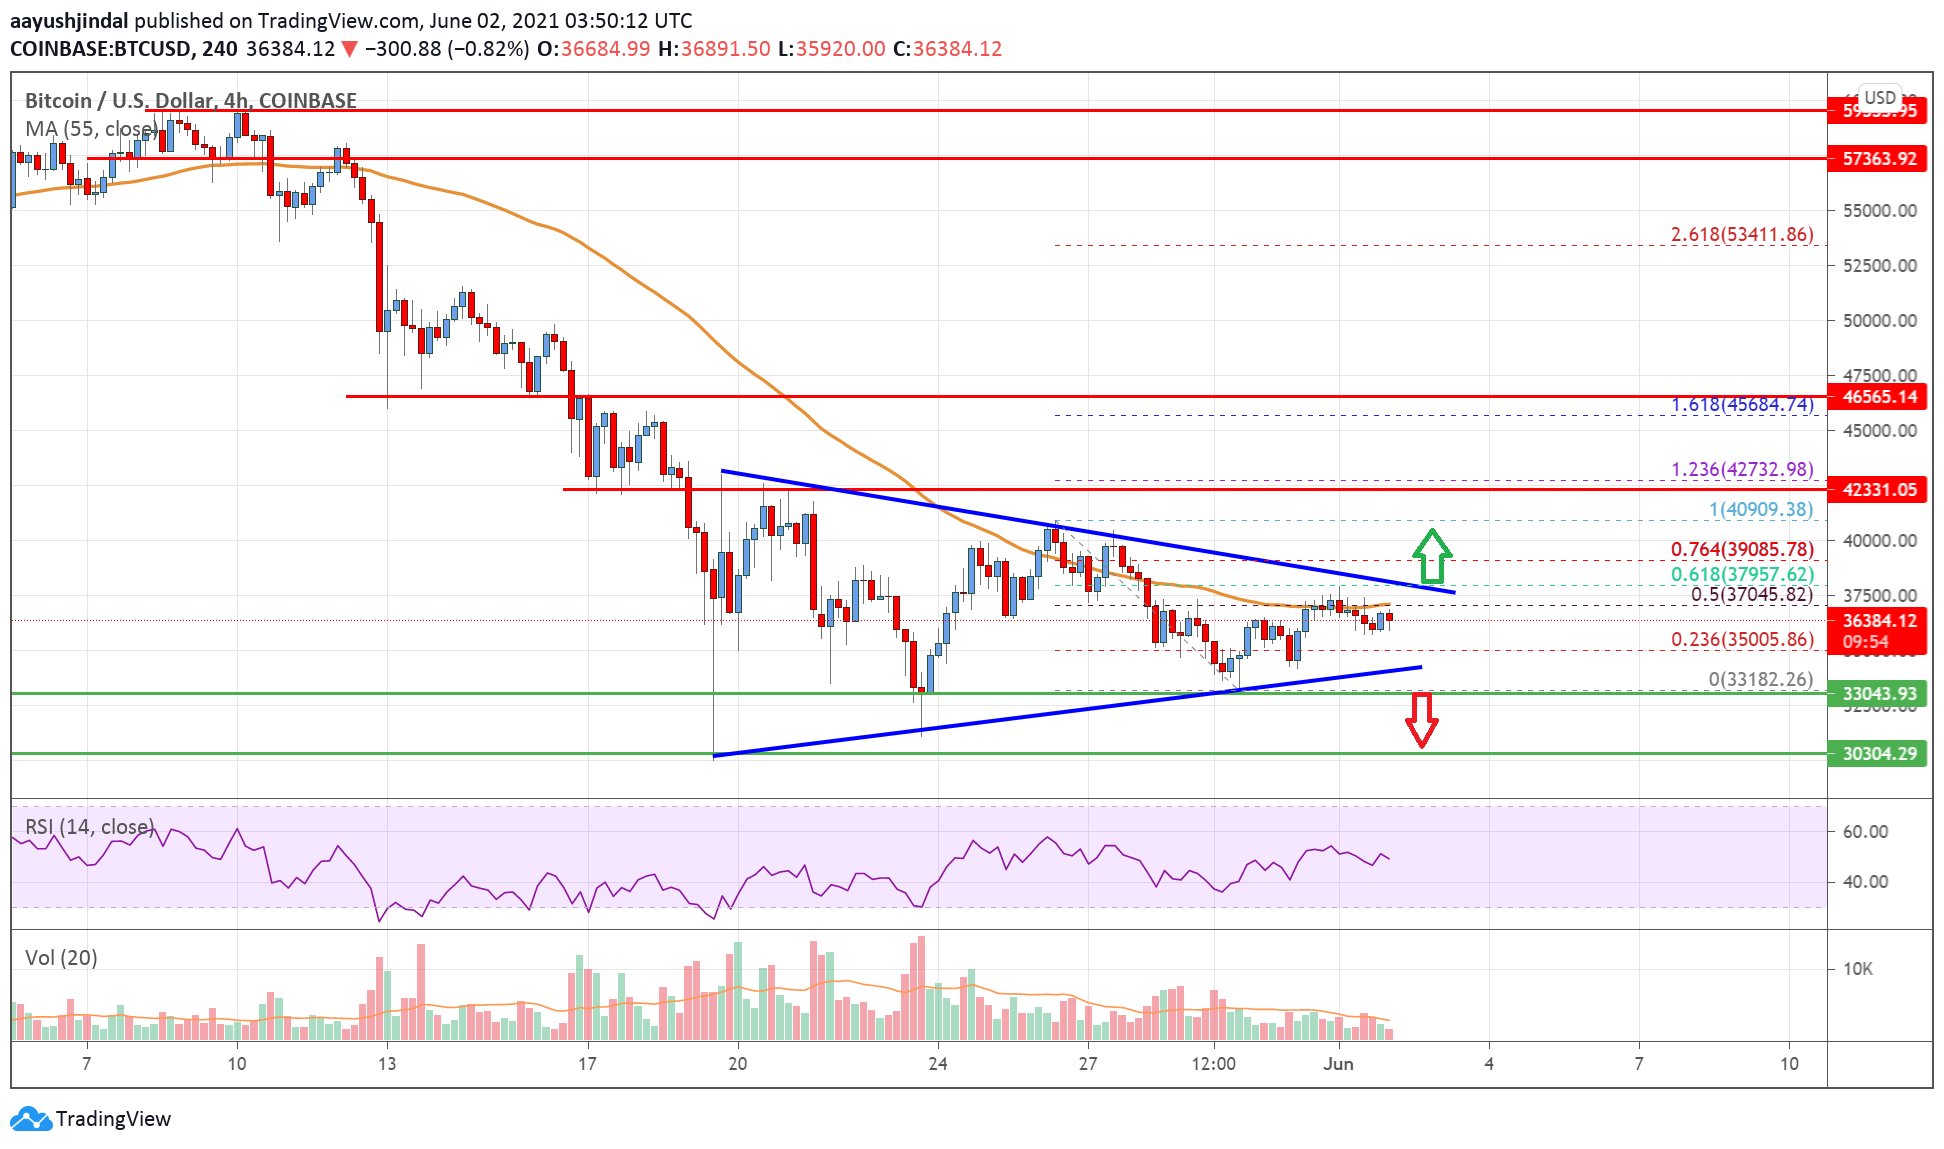
Looking at the chart, bitcoin price is clearly trading near $37,000 and the 55 simple moving average (4-hours). Overall, the price is likely to start a major increase if there is a clear break above $39,000 and $40,000.
Technical indicators
4 hours MACD – The MACD is slowly gaining momentum in the bullish zone.
4 hours RSI (Relative Strength Index) – The RSI is now near the 50 level.
Key Support Levels – $35,000 and $34,500.
Key Resistance Levels – $37,000, $39,000 and $40,000.


Leave a Reply
You must be logged in to post a comment.