
- Bitcoin price started a downside correction from the $10,420 swing high against the US Dollar.
- It tested the $9,280 region and currently trading nicely above key supports.
- There is a key bullish trend line forming with support near $9,540 on the 4-hours chart of the BTC/USD pair (data feed from Coinbase).
- The pair is likely to start a fresh increase as long as it is above the $9,280 swing low.
Bitcoin price is trading in a nice uptrend above $9,540 and $9,300 against the US Dollar. BTC could start a major increase if it clears the $9,880 and $10,000 resistance levels.
Bitcoin Price Analysis
After a strong decline, bitcoin price found support near the $9,300 and $9,280 levels against the US Dollar. BTC remained well bid above $9,300 and the 55 simple moving average (4-hours).
A low was formed near the $9,278 level and the price recently corrected higher. It broke the $9,400 level and settled above the $9,500 level. There was a break above the 23.6% Fib retracement level of the key decline from the $10,419 high to $9,278 low.
However, the price seems to be facing a strong resistance near the $9,880 and $9,920 levels. The 50% Fib retracement level of the key decline from the $10,419 high to $9,278 low is also acting as a hurdle.
If there is a clear break above the $9,880 resistance zone, the price could continue to rise towards the $10,000 and $10,200 levels. The next major resistance is near the $10,400 level, above which there are chances of a sustained upward move towards the $10,800 level.
On the downside, an initial support zone is near the $9,540 level. There is also a key bullish trend line forming with support near $9,540 on the 4-hours chart of the BTC/USD pair.
If there a downside break below the 55 simple moving average (4-hours) and the trend line support, the price could revisit the $9,280 support. Any further losses may perhaps lead the price back towards the $8,650 support zone in the near term.
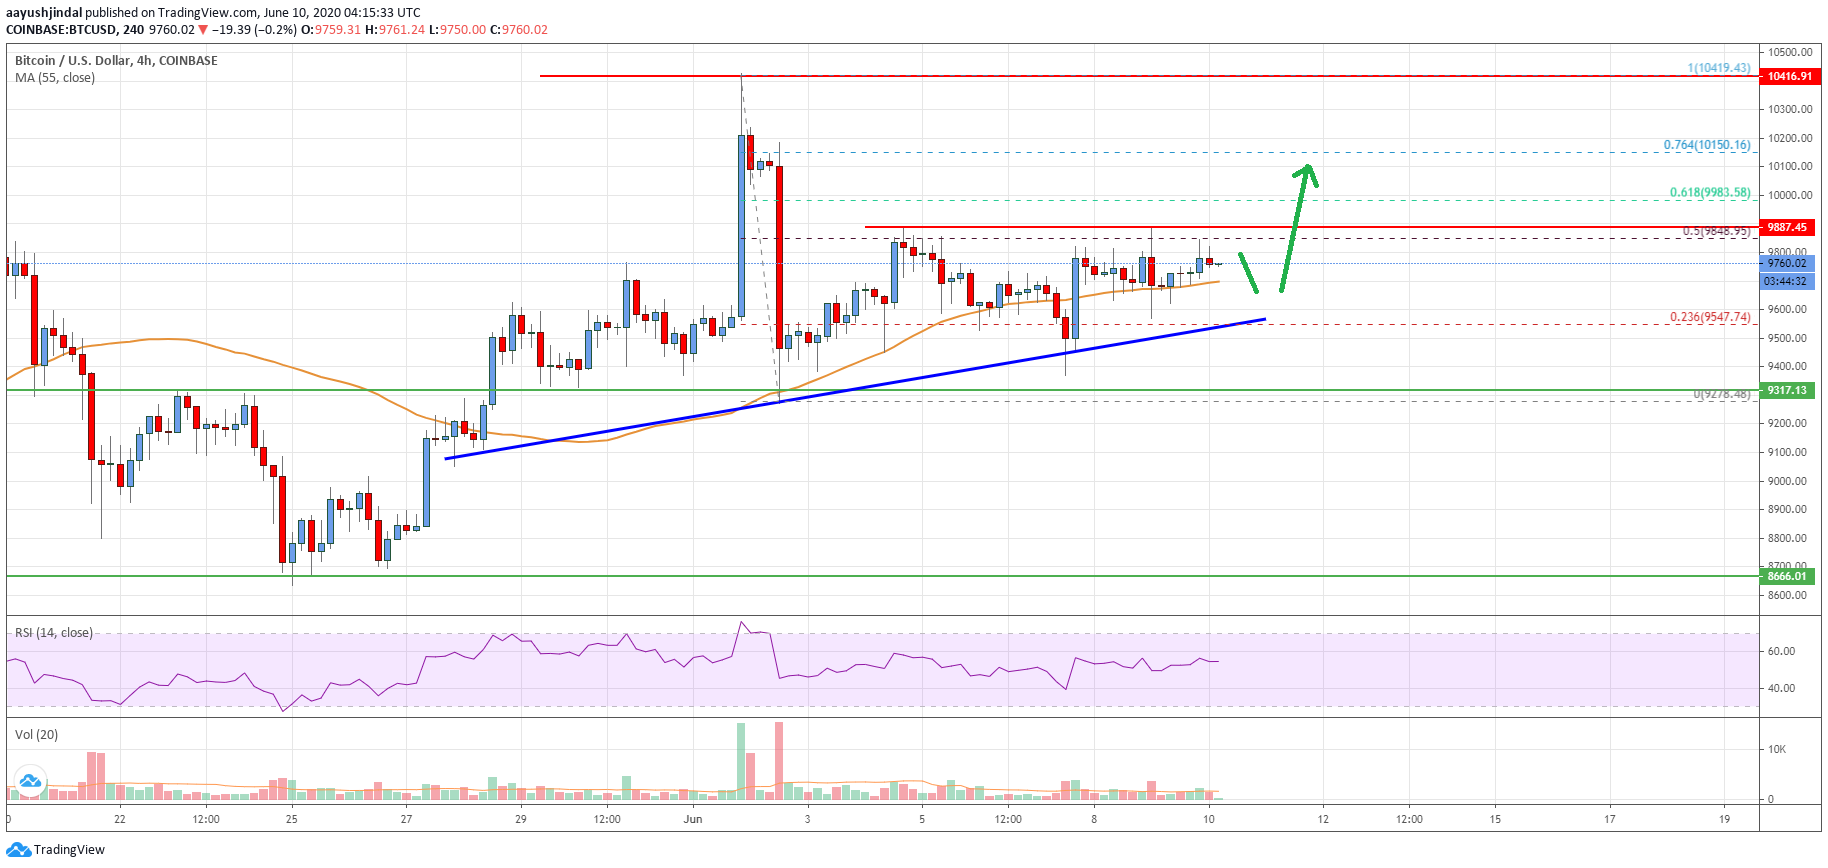
Looking at the chart, bitcoin price is clearly trading in a positive zone above the $9,500 zone and the 55 SMA. As long as there is no clear break below the $9,280 swing low, the price is likely to clear the $9,880 resistance and continue higher.
Technical indicators
4 hours MACD – The MACD is slowly losing pace in the bullish zone.
4 hours RSI (Relative Strength Index) – The RSI is currently well above the 50 level.
Key Support Levels – $9,540 and $9,280.
Key Resistance Levels – $9,880, $9,920 and $10,400.


Leave a Reply
You must be logged in to post a comment.